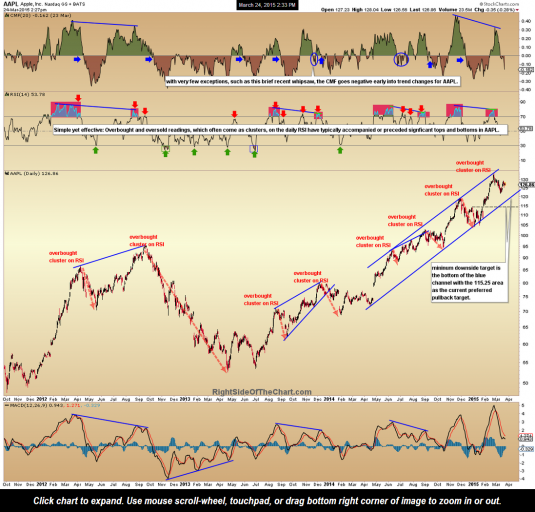
This is the same daily chart of AAPL available through the Live Charts page. About a month ago, I had updated this chart to highlight the most recent overbought cluster & negative divergence on the RSI. The history of previous corrections in AAPL has been highlighted on this chart for quite some time and so far, AAPL has indeed begun drifting lower since the last RSI overbought cluster, with the stock in a fairly steady short-term downtrend since the Feb 24th highs.
Inline with my expectation for further downside in the QQQ would be additional downside in AAPL with a minimum target of the bottom of the blue ascending price channel & a preferred target at this time of the 115.25 area.
I am not adding AAPL as an official trade idea but more so wanted to share my thoughts on where the stock might be headed as AAPL is the largest component of the QQQ and the fact that the near-term technical outlook on AAPL meshes with my near-term take on the Q’s.


