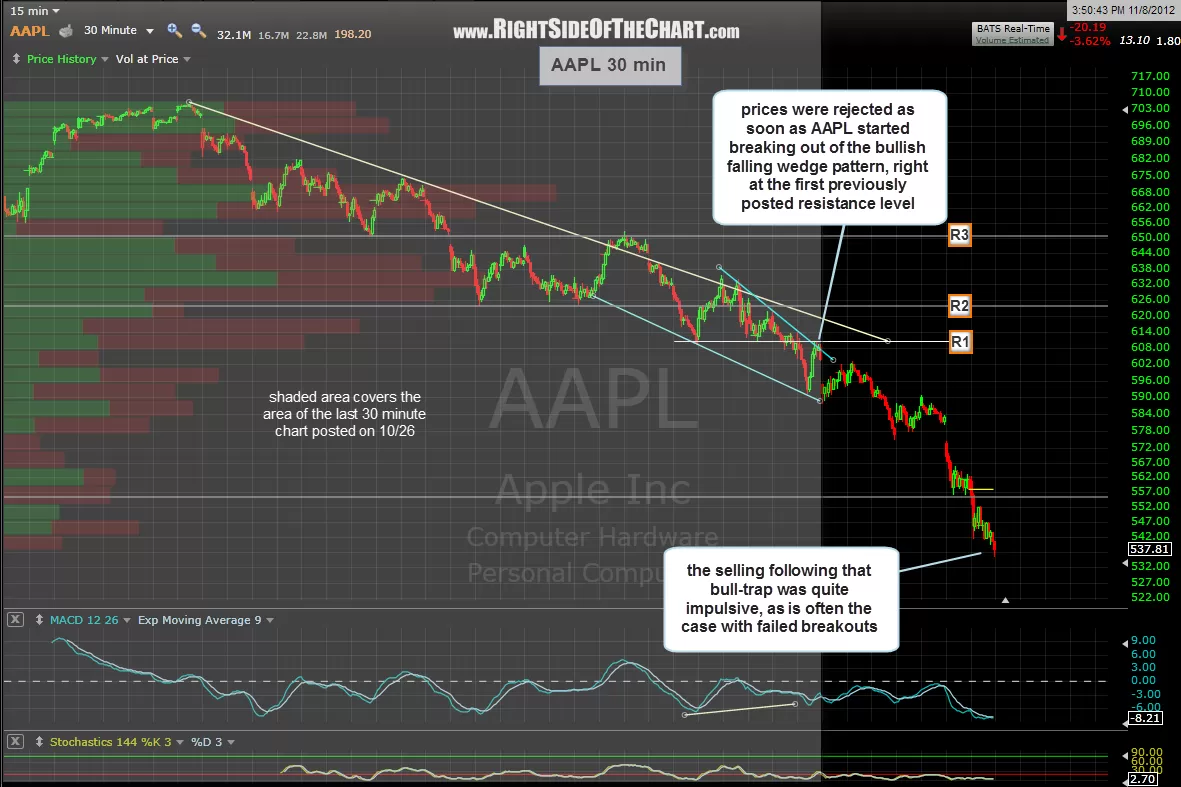
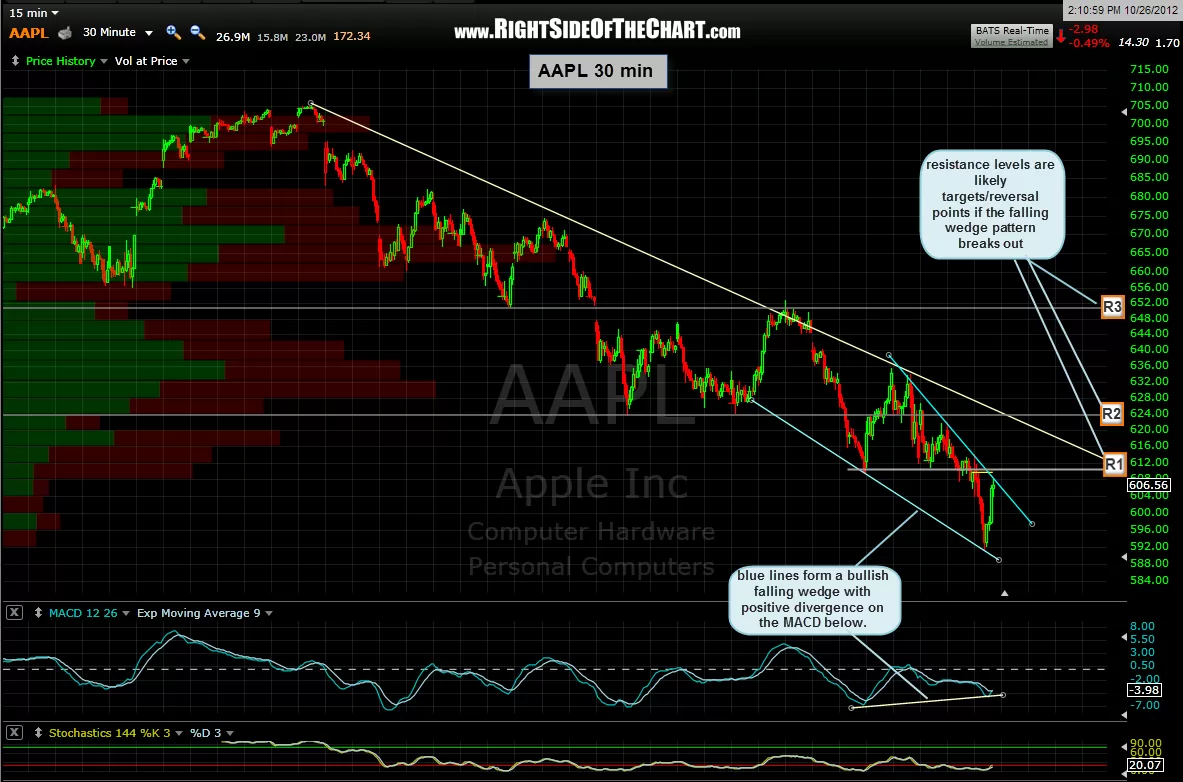
About 2 weeks ago I pointed out a bullish falling wedge pattern that had set up on the AAPL 30 minute chart. In that post (which can be viewed here), I also mentioned how this would likely prove to be a bull-trap, with the breakout failing soon after happening. As you can see from the updated chart below, AAPL turned down at the first resistance zone (R1) and sold off quite impulsively since then, a typical reaction to a failed pattern breakout.
The expectation of this bull-trap also allowed me to not get shaken out of my short positions, as mentioned in that post. I often talk about my “anticipatory” trading style and I believe this is a good example of that: Spotting a bullish pattern on the most followed and actively traded stock there is (which undoubtedly attracted many more eyes to that pattern as well) yet making a decision based on a myriad of other factors and deciding to take the “other side” of an obvious bet.
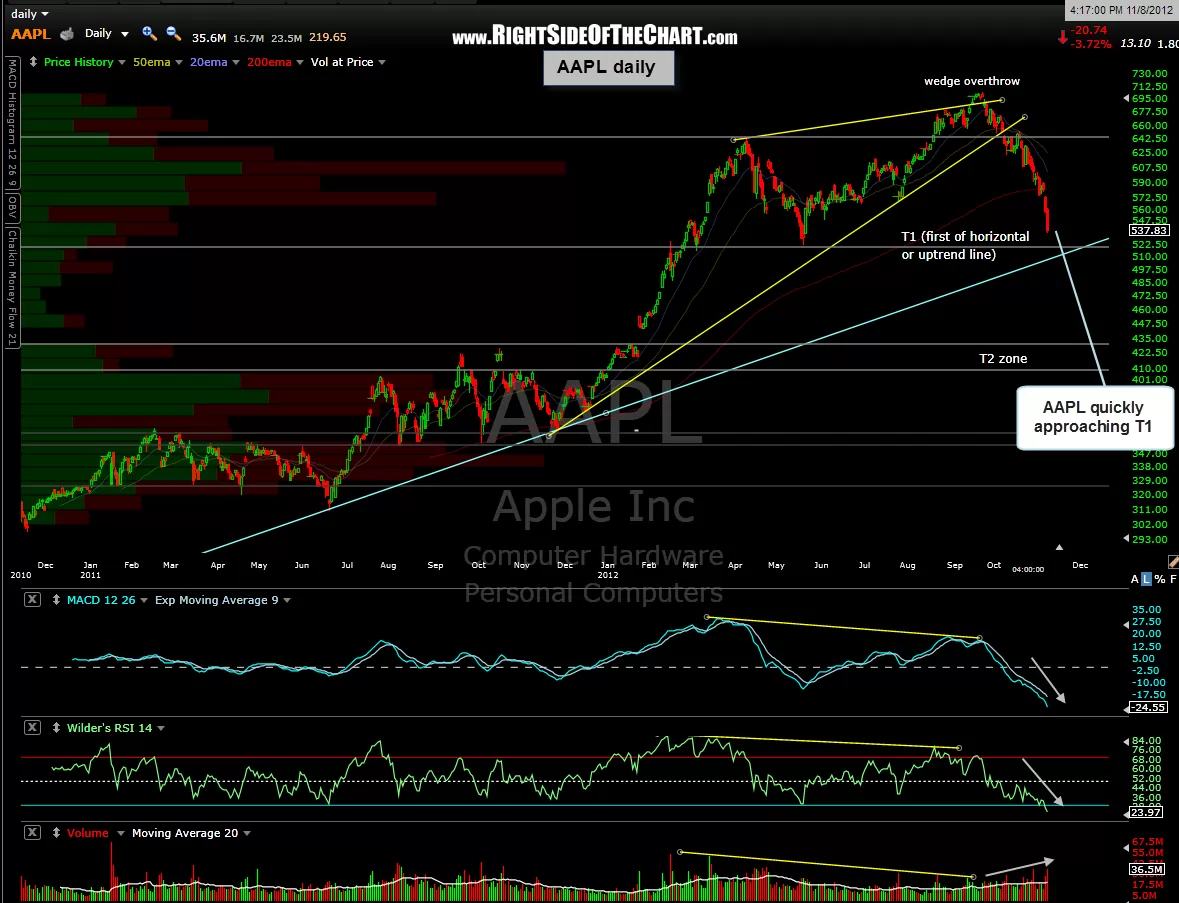
For those in the AAPL short or just following the stock as a cue for trading the broad market, be aware that AAPL is rapidly approaching my first target, where I do believe the odds for some type of reaction (a pause or bounce) are likely. Previous & updated 30 minute charts below plus the updated AAPL daily chart: