
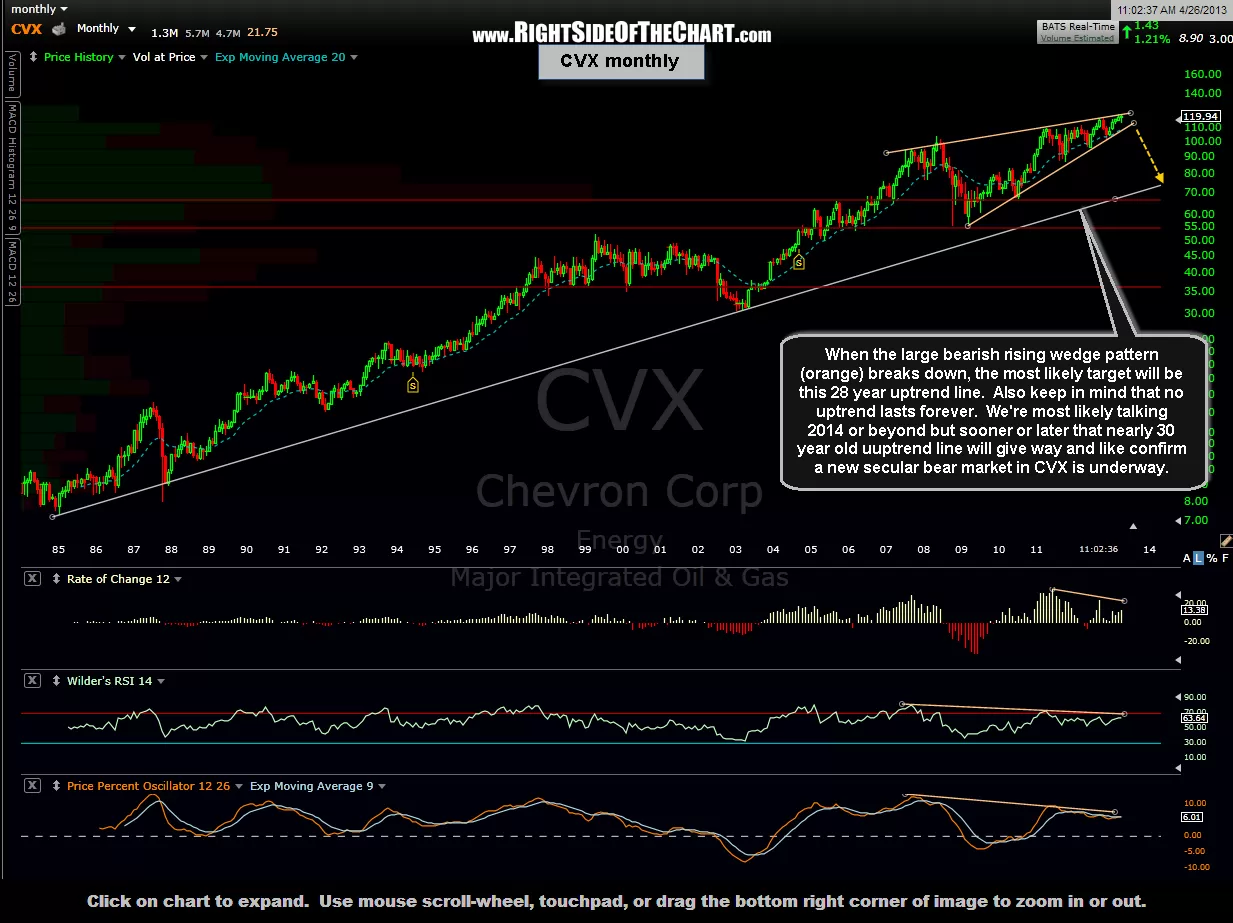
I’ve recently shared my thoughts on XOM, the largest stock in the world and largest component of the S&P 500 but here’s another behemoth which is sure to have an impact on the broad market, assuming these patterns play out. CVX (Chevron Corp) is currently the 4th largest component in the S&P 500 so I’ve put together a series of charts, complete with annotations, starting with the daily time frame and zooming all the way out to a 28 year, monthly period chart.
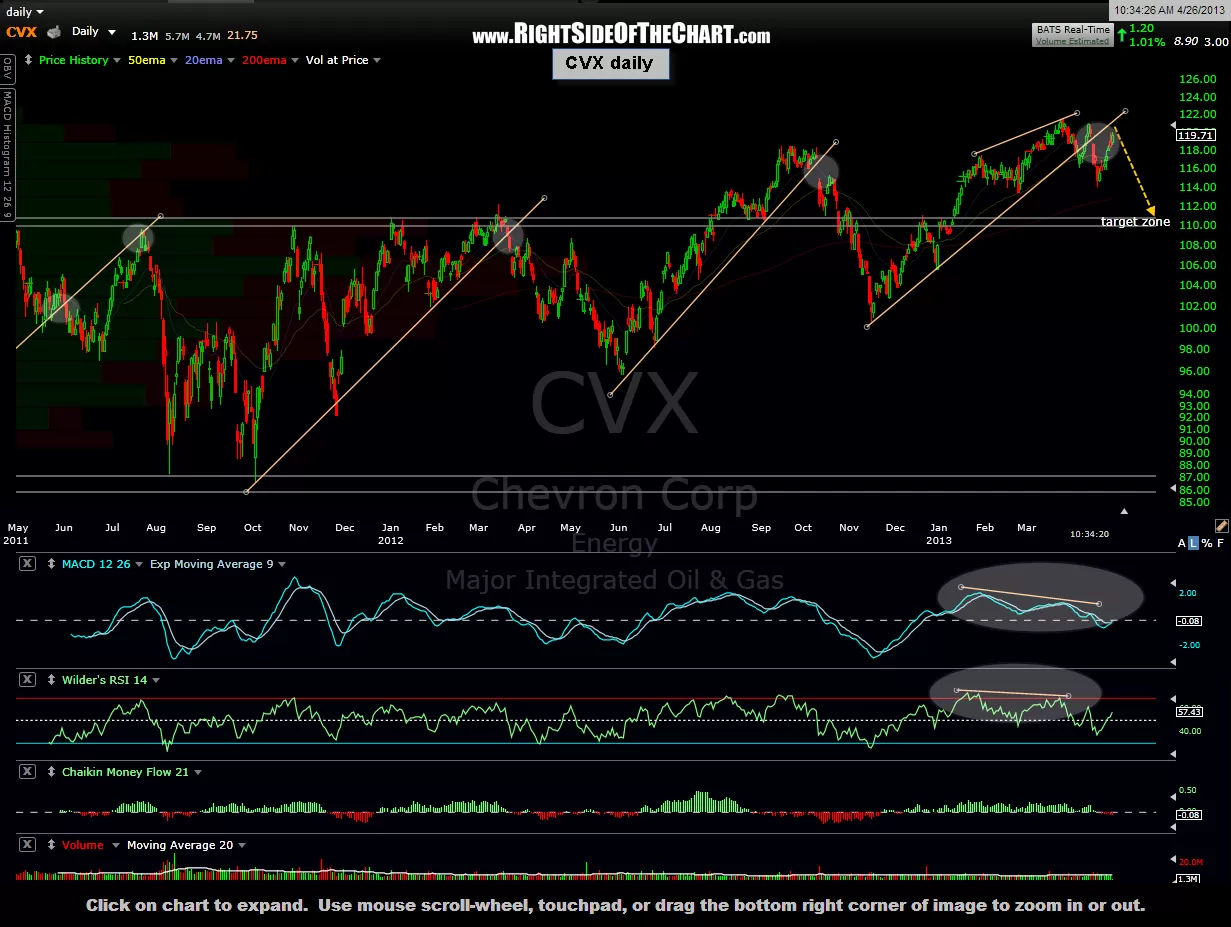
By my interpretation, these charts look bearish on all time frames but in the short-term (i.e.-daily chart), I can easily see a little more upside in CVX in order to backtest the recently broken uptrend line. That may or may not happen & if so, the upside should be limited. As such, I am going to go ahead an add CVX as an active short trade here at current levels (120.15 as I type), with stops and the exact target levels to follow soon. As the broad market continues to show resiliency at this time, one might also opt to use a scale-in strategy, maybe shorting a half position here & adding the second half either on a backtest of the recently broken trendline or following any decent technical evidence of a likely reversal.