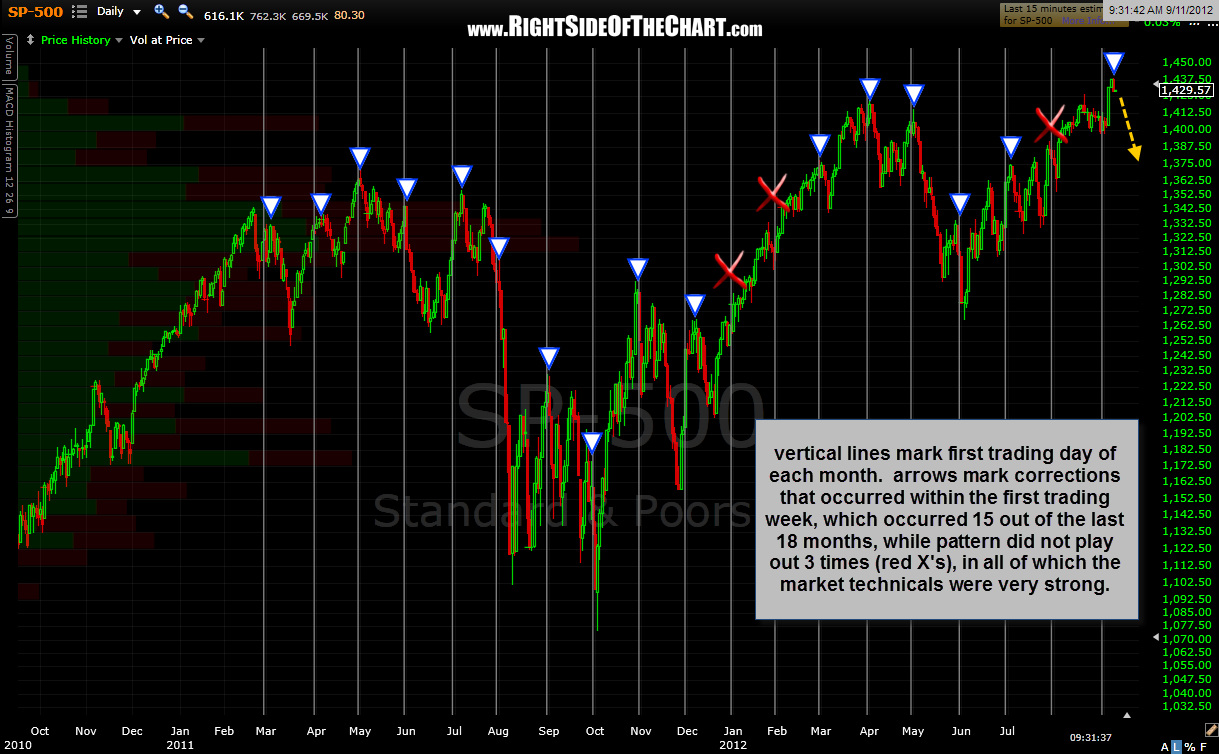
a week ago yesterday, i made this post which highlighted a pattern that i’ve noticed for years now, whereby the market, for whatever reason, is pumped up or at least held up into month-end and more often than not, a correction begins within the first week of the each new trading month. my final comments in last week’s post were: “…we have bearish technicals all the way out from the weekly charts down to the 60 minute time frames, thereby sharply increasing the odds that this pattern plays out in september (the stock market begins at least a moderate correction within a week).”
at the risk of jumping the gun, as the market is clearly trading in positive territory today, we did get our first down day of the month yesterday, which was the 5th trading day of the month, exactly 1 week after that post. although i never put too much stock (no pun intended) into any single pattern, i will be on the lookout for a reversal in the markets at some point today and a red close to see if this pattern can extend it’s current 83% success rate. as the updated chart below shows, 15 of the last 18 months have seen a significant correction within the first week of trading. i won’t jump the gun on this one, as i’m already positioned heavily short, however i will likely add to my short exposure later today if today’s early morning gains are faded and it looks like we headed for another red close.

