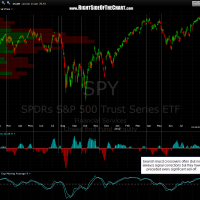
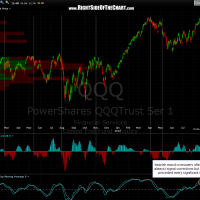
here’s the daily charts of SPY & QQQ highlighting most, but not all, of the bearish MACD crossovers over the last couple of years. bullish and bearish MACD crossovers are not “all-clear” buy and sell signals in themselves. as with most other indicators or signals in TA, they should be used in conjunction with other confirming indicators or signals. therefore, i only marked the bearish signals (as most clearly indicated when the MACD histogram crosses from a positive to a negative reading) that played out and i tried to set the vertical lines slightly to the right of the signal as in the real-world, we must wait to see an official cross, as the MACD will occasionally looks poised to cross but then bounce off the signal line without crossing it. therefore, we don’t get the signal until a red (negative) bar prints at the close of trading.
what you’ll notice that that most, but not all, bearish MACD crossovers on the daily time frame resulted in a trend reversal, i.e.- a correction. again, there were several sell signals that i did not mark as those mostly proved to be false signals as this is not a stand-alone, highly effective sell signal. however, note that every significant correction was marked by a bearish MACD crossover either just before or just after prices peaked and the correction began.
as you can see from these charts, we have a confirmed crossover in SPY as of last thursday and although the QQQ MACD remains above the signal line, from the look of the histogram, any additional downside from at or near current levels should trigger a bearish crossover.


