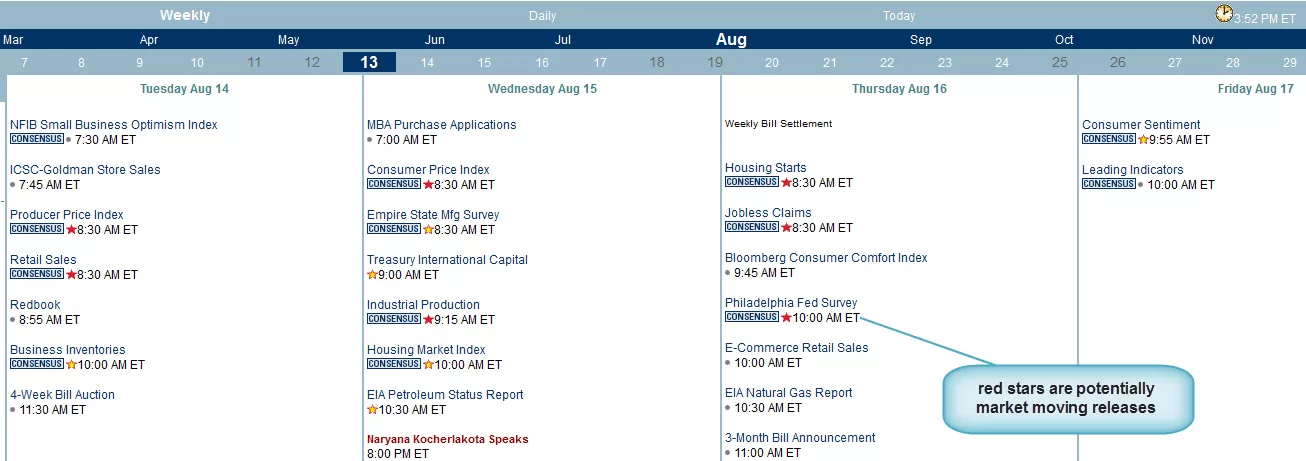
for the last week, the market has traded range-bound as the economic calendar has been very light. that changes starting tomorrow morning with the release of the PPI and Retail Sales at 8:30am ET and will continue with several other potential market moving economic releases throughout the week. the economic calendar can be accessed anytime via the link under the “Tools of the Trade” section on the right hand side of the site.
the disconnect between rising stock prices and deteriorating economic fundamentals will not last much longer IMO. therefore, i expect a mean reversion to take place soon: either the recent downtrend in the fundamentals will reverse and begin to trend higher or stock prices will play catch-up on the downside as the economy continues to deteriorate. it’s really as simple as that IMO although the hard part is determining which of the two outcomes will occur and exactly how long it will take for the mean reversion to play out.
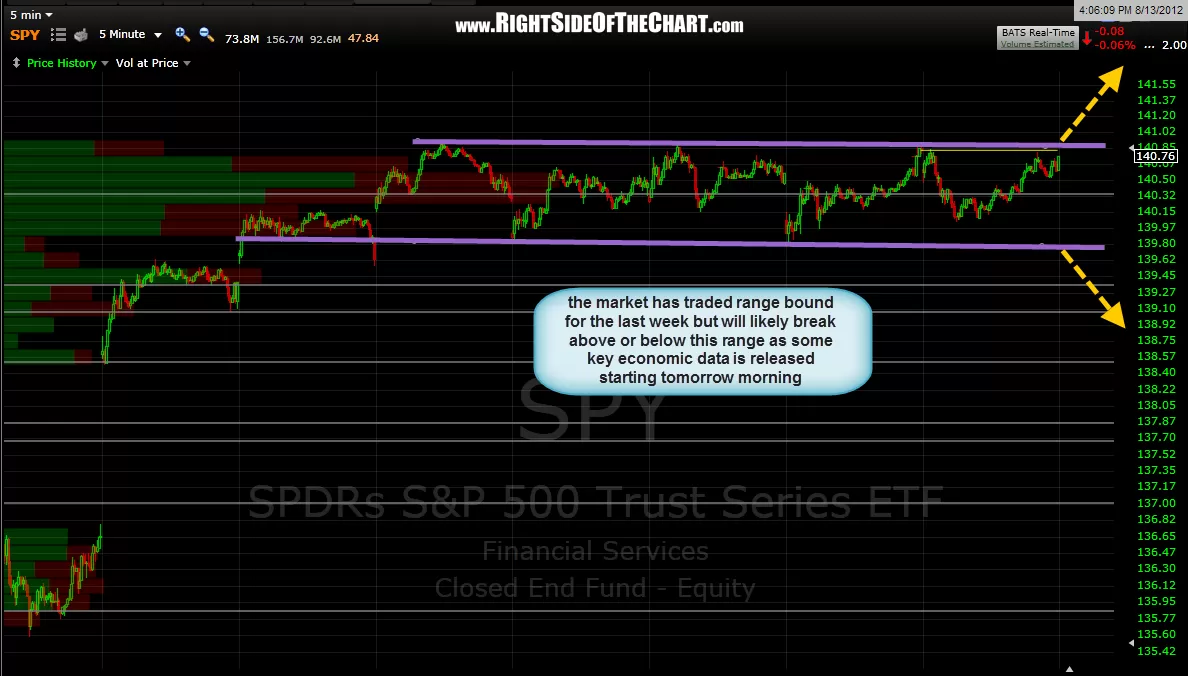
of course, that’s more of an intermediate to longer-term view on things whereas this 5 minute SPY chart below tells me that we are very likely to see the market break one way or the other over the remainder of this week and most likely starting tomorrow. as you can see, the market has basically gone nowhere over the last week as it has chopped around inside of a trading range, frustrating both bulls and bears alike. stock market patterns don’t continue forever, especially tight, short-term patterns like this. as the bulls are awaiting confirmation that the recent downtrend in fundamentals was just a temporary blip on the road to recovery and the bears await further confirmation that the economy is most likely headed towards, if not already in a recession, one or the other is likely to be proven correct soon. the fact that stock prices are up so much since the june 4th lows (about 11%), tells me that any additional upside in stocks, should the data start trending positive, might be somewhat limited, at least in the near-term while any downside surprises could be the catalyst for a significant sell-off.
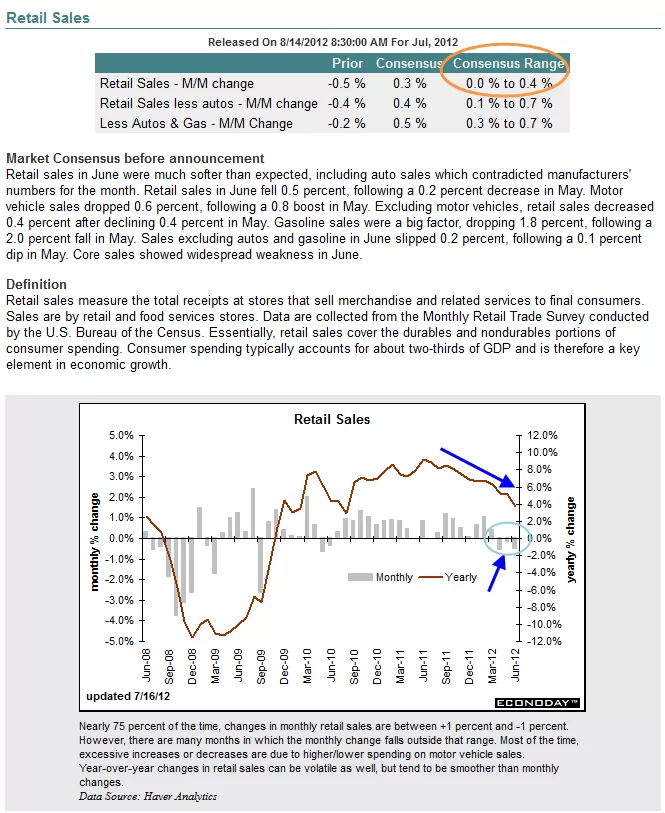
one of the most important releases this week could prove to be the retail sales numbers tomorrow morning. as you can see in the chart below, retail sales have clearly been declining in recent months and the consensus month over month expectations range from flat to up 0.4%. any print below zero would only help affirm the bearish case while an upside surprise would obviously be bullish. i’ve also included a snap-shot of some of the other potentially market moving reports due out in the next few days.
with the $VXN making a new multi-year low today and the $VIX dropping to literally 1 point above it’s multi-year low today as well, i’d say that the R/R continues to favor the short-side, regardless of the current trend. to clarify, that statement does not necessarily mean that the odds that we move lower from here are above the odds of moving higher. what it does mean is that even though the odds of prices going lower from here might be below the odds of prices moving higher, the risk of being caught long in sudden large drop in stock prices outweighs the potential gains of remaining heavily long at this point.