here’s a couple of longer term charts which, by my interpretation, continue to warrant caution on the long-side. again, these are weekly and monthly charts so these red flags can be expected to take weeks or even months to play out to the downside, assuming they even do cause a correction. the technical caution signs on these charts are one of the reasons that i do not plan on aggressively trading the long-side even if the broad markets break out to new highs in the following days or weeks, other than maybe some quick hit-n-run trades. this is not to say that the markets can’t or won’t go higher from here or that we must have a significant sell-off soon, just that i believe the next 10-20% gain in the market almost certainly won’t come as easy as the last 10-20%.
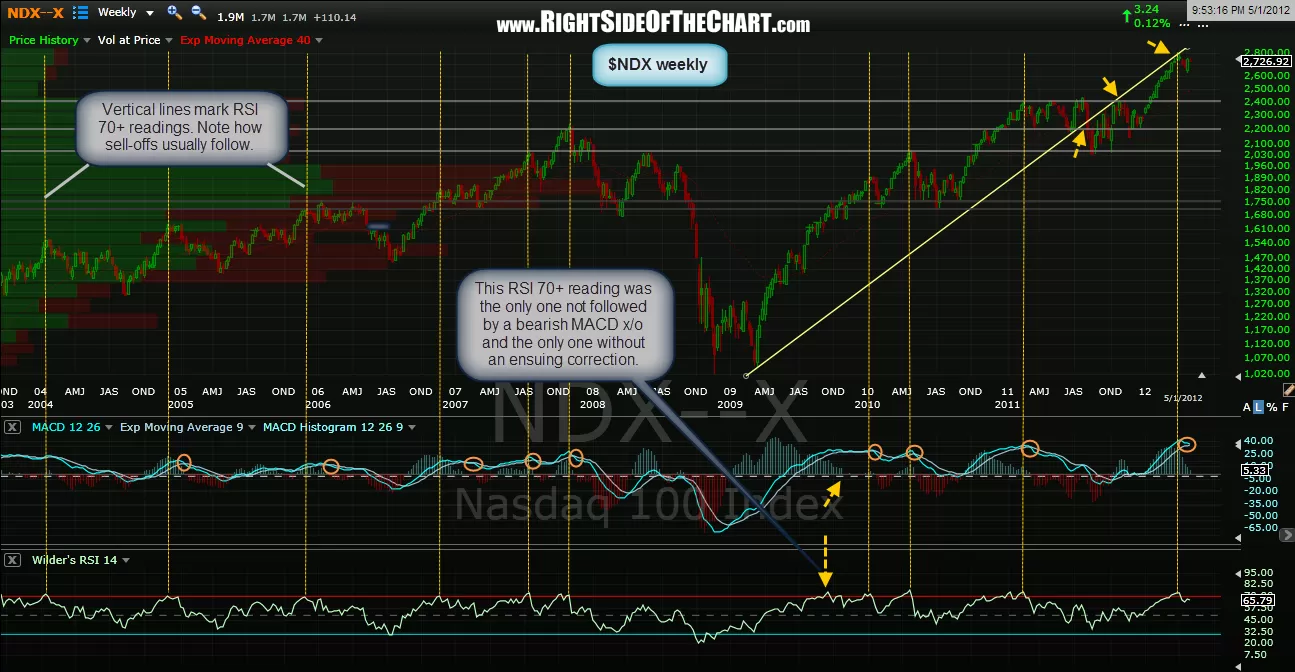
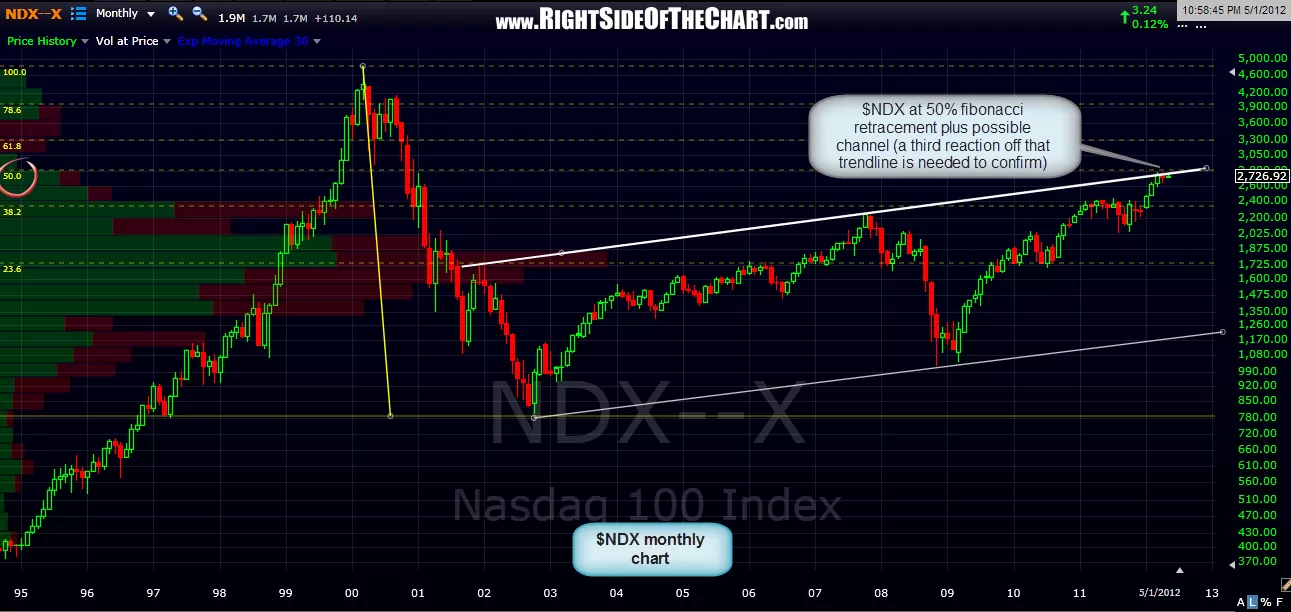
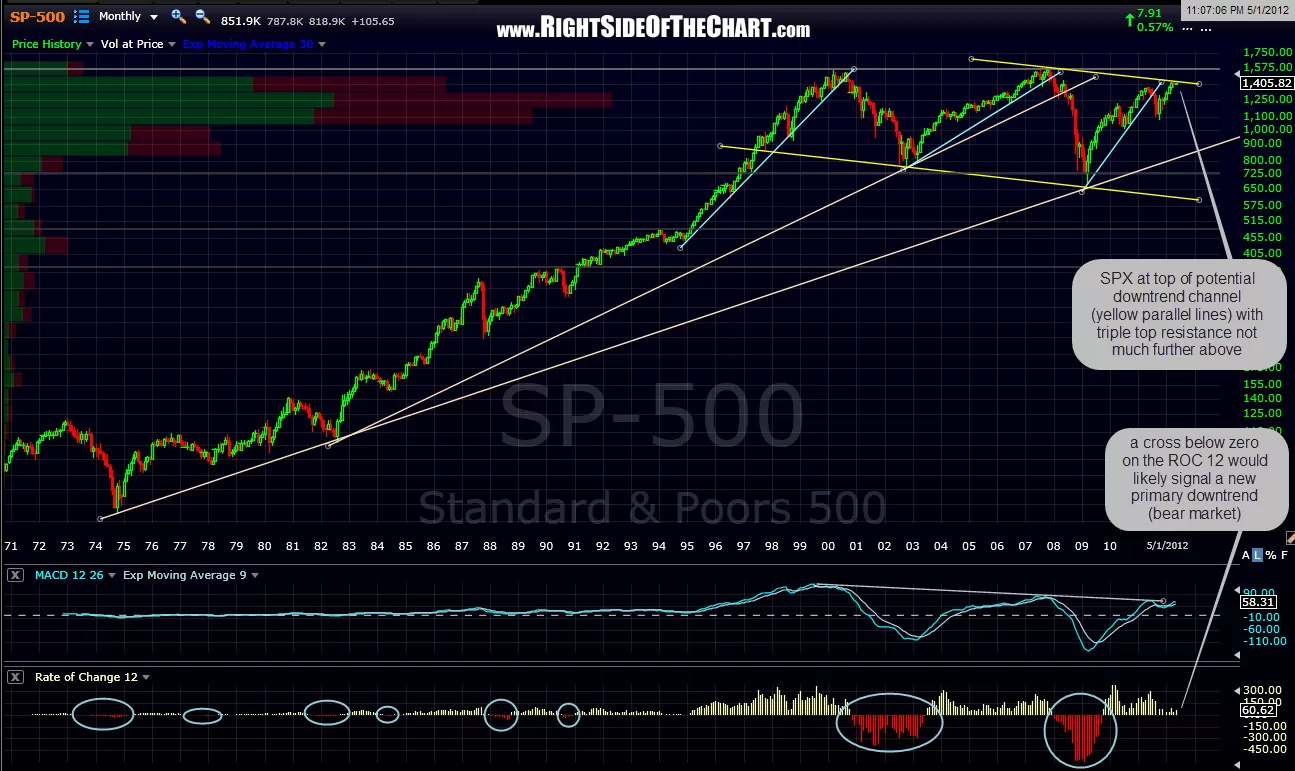
as you can see from the RSI 70+ readings in the NDX weekly chart below, similar technical readings in the past have almost always produced significant sell-offs and at best (using the MACD cross-over confirming signal) have results in months of frustrating, sideways chop with the market going basically nowhere. first chart is the SPX monthly, followed by the NDX monthly and weekly charts. for those interested, i did a video overview discussing my interpretation of the NDX weekly chart which you can click here to view.