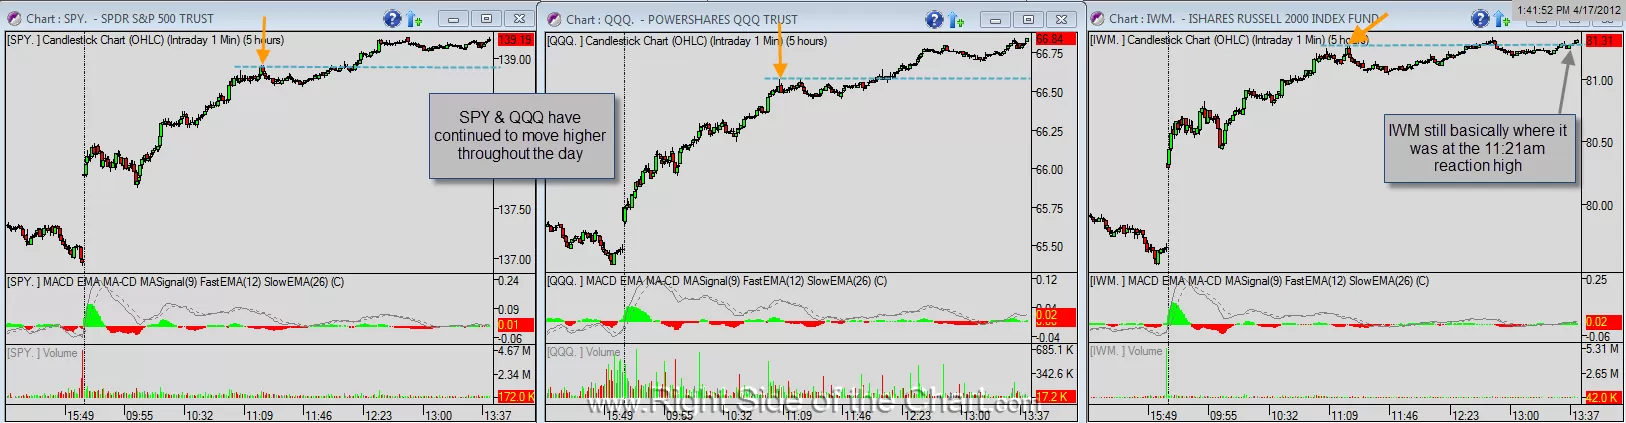
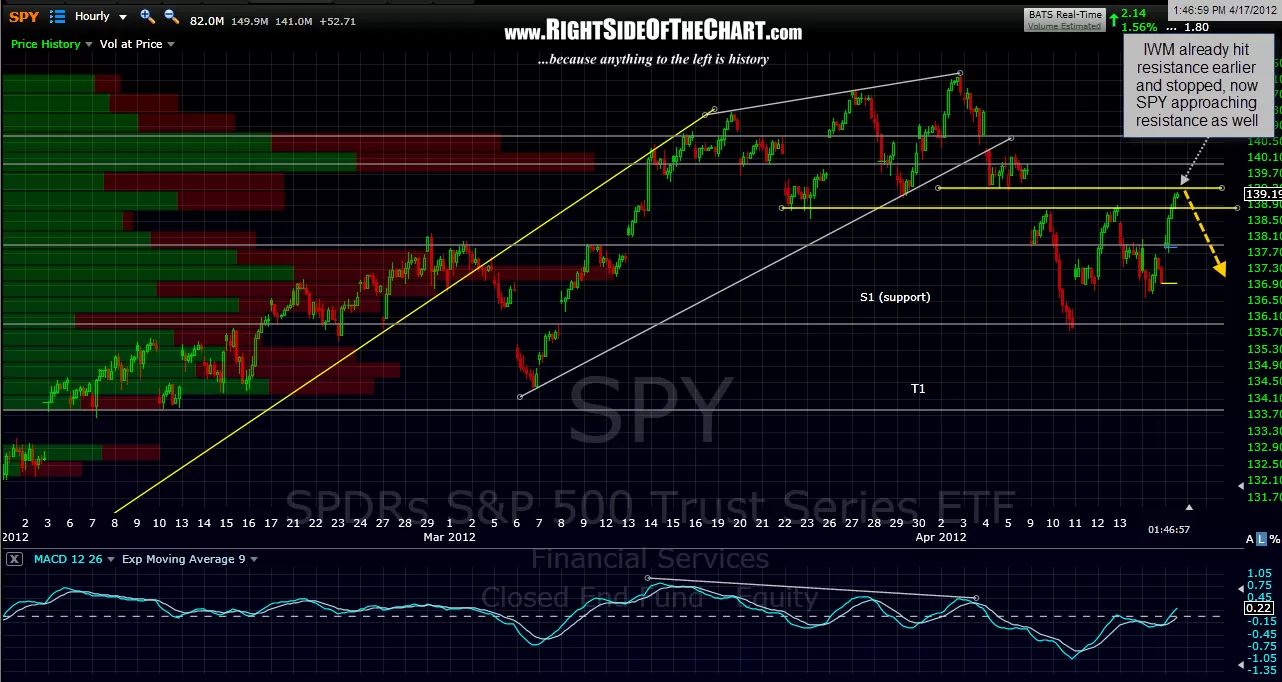
here’s a side-by-side comparison of the 1 minute charts of SPY, QQQ and IWM and as you can see, IWM has underperformed those other indices since running into resistance earlier today. the second chart is an updated 60 min chart showing that the SPY is now quickly approaching key resistance as well. with only 2 hours left in the trading day, it could just flounder around this level into the close. one thing that i will be watching for is a break of the pattern that has existed for months, if not years now and that is for a trend day like this to close at or near the highs of the day. if we we to see some impulsive selling into the close today, it would break that pattern and may help signal a possible intermediate-term trend change.
if the market does continue to hold up into the close today, the odds of a decent sized gap one way or the other tomorrow would be pretty good IMO, either gapping us above the current resistance levels just overhead (bullish, as a lot of shorts would be trapped) or gapping down off and away from these resistance level (obviously bearish for the opposite reasons). until i see which way the markets break from here, i’ll remain partially hedge as to not get caught on the wrong side of a potential gap.