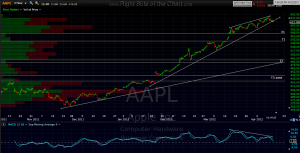
please note that the last AAPL chart that i posted was a 120-min chart (i mistakenly referred to it as a 60-min chart). really not much difference and the targets remain the same although i will go in an edit the title of that last post to reflect the correct time period. here’s the updated 120-min which shows that AAPL is just starting to break below that first uptrend line. i added another support level (S1) where i’d expect to see the first potentially tradable reaction. however, i’d still expect AAPL to move down to the first target (T1) before any meaningful bounce. all that assumes that we see a solid close (120 min – 4 hour candlestick) below this trendline, preferable on above average volume. at this point, i will move AAPL to the Trade Set-ups catergory, using a close below that upper-most trendline on the 4-hour chart as the official entry. keep in mind when trading off a particular time-frame, one can often gain better entry prices from using shorter-term charts to trigger an entry although that also increase the likelihood of a false buy or sell signal (i.e.-whipsaw).
Results for {phrase} ({results_count} of {results_count_total})
Displaying {results_count} results of {results_count_total}


