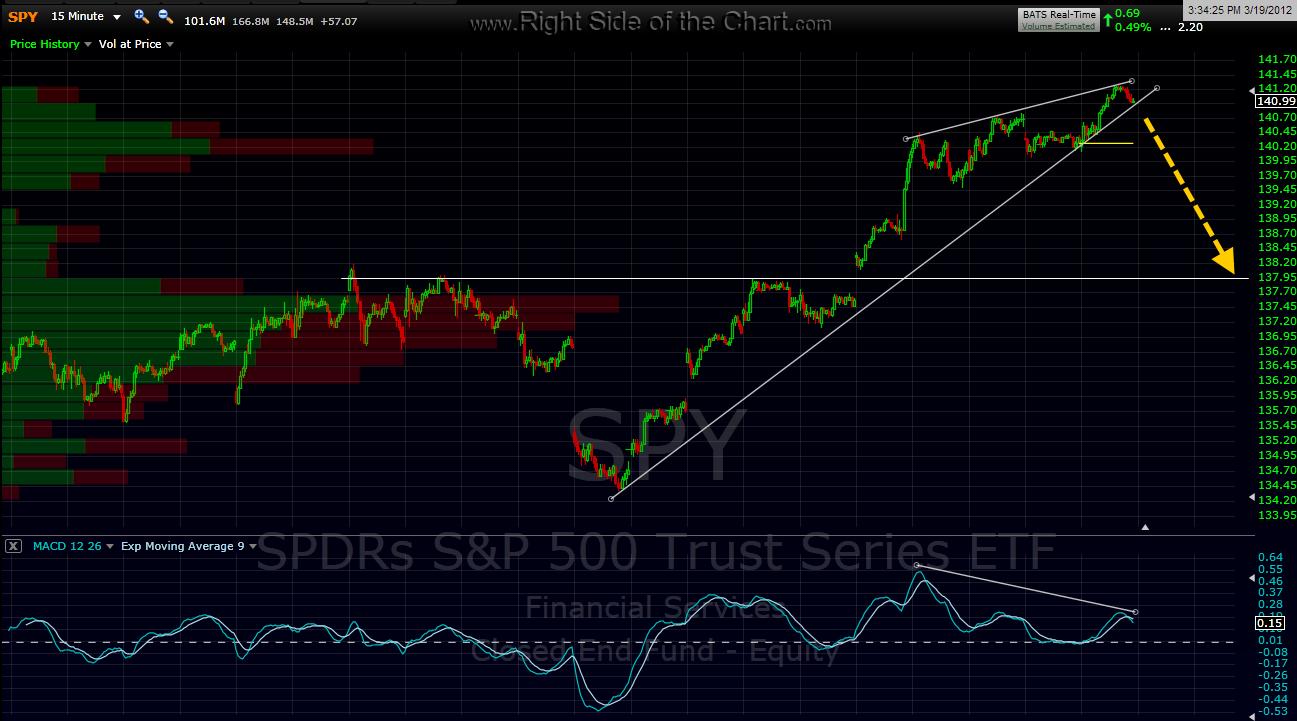
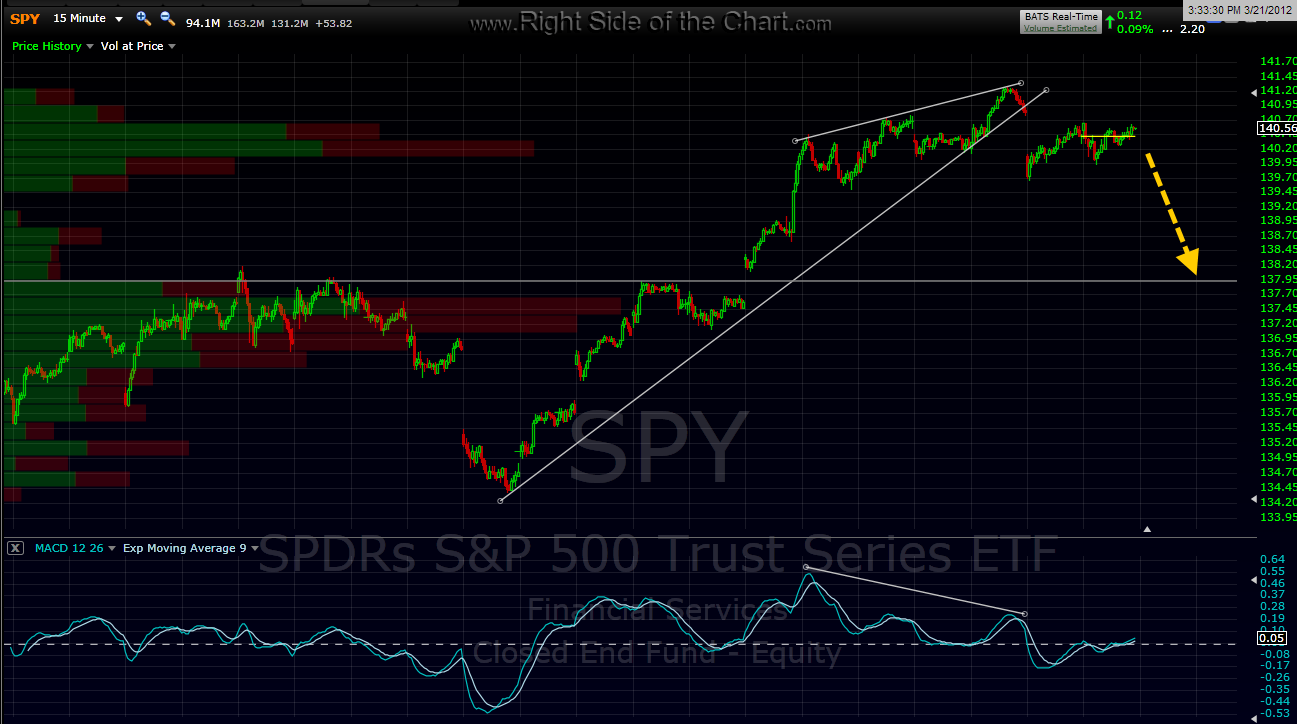
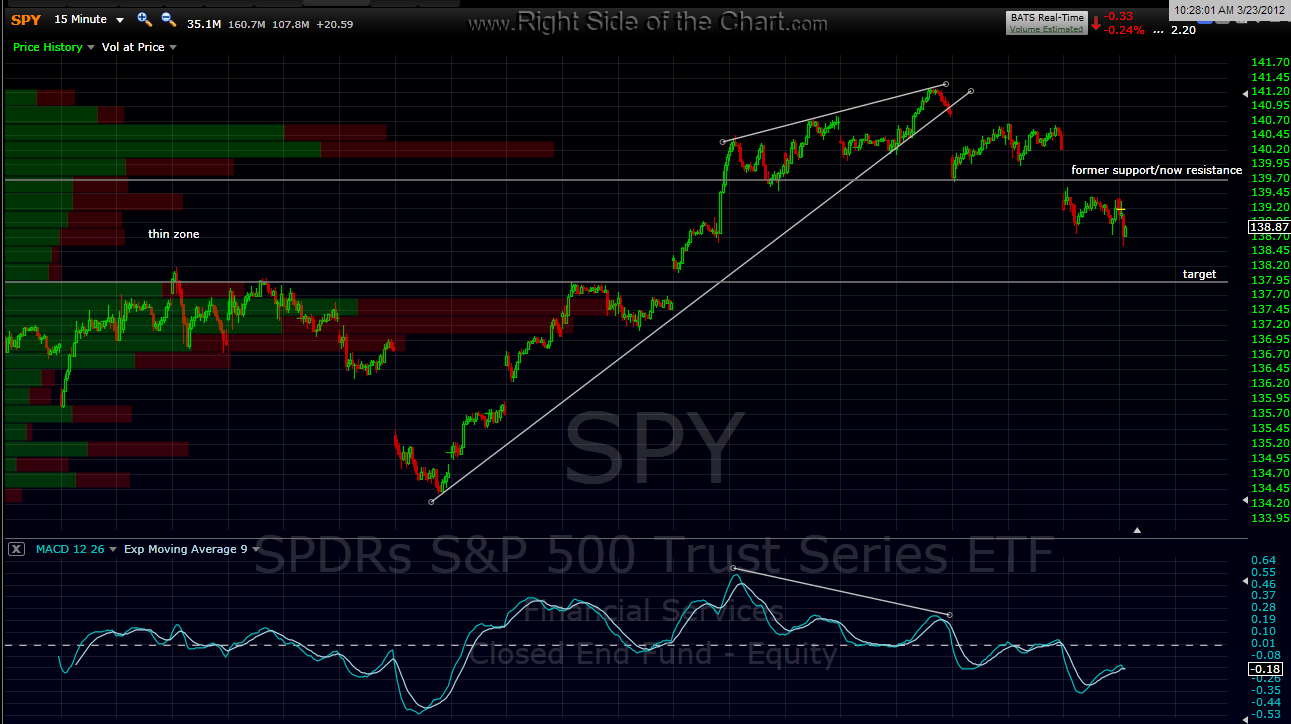
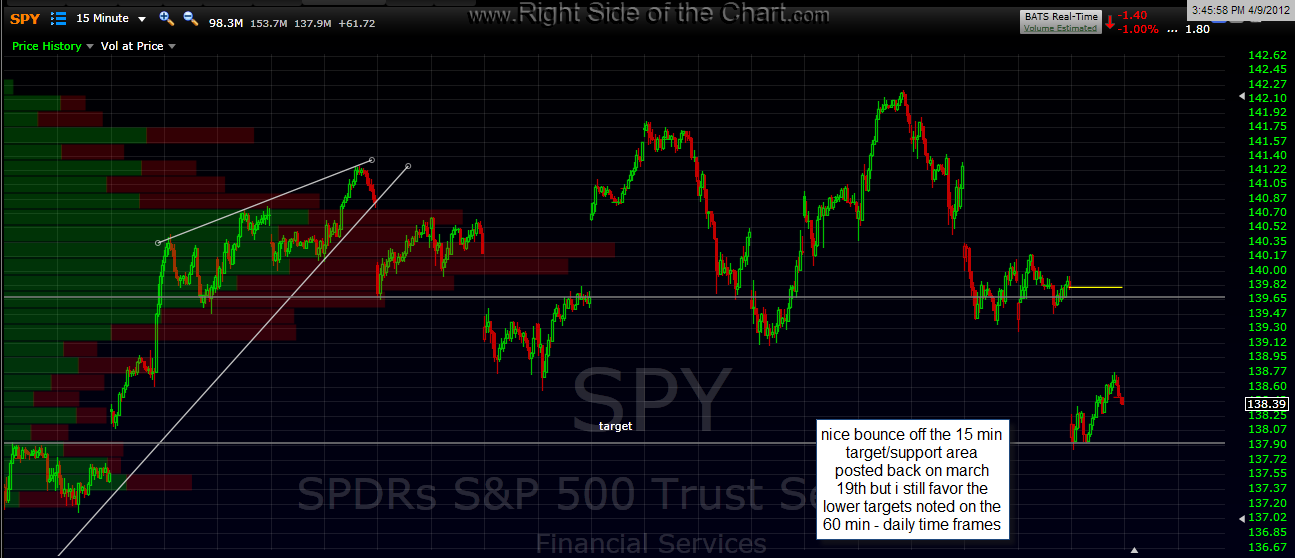
here’s the string of SPY 15 min charts showing the rising wedge that broke down on march 19th. it may have taken a while to get there but that target/support level was hit at the lows today and produced this intraday bounce, which i expect to be fleeting. keep in mind that the SPY, while taking much longer to get there than expected, only rose 1% above the point where it broke down from that rising wedge pattern. charts in order with today’s updated chart last.
i have spent most of the afternoon working with a programmer on some improvements to the site which i expect to have completed by tonight or tomorrow morning. basically, these changes should make it much easier to view all the trade set-ups, active trades, and completed trades on the site. more on that later.