
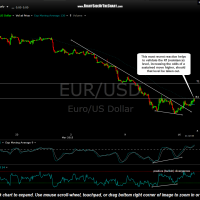
The R1 (1st resistance) level in the EUR/USD currency pair was tagged today with the expected initial reaction (i.e.- pullback) ensuing. The R1 level was pointed out in the previous EUR/USD 60 minute chart (first chart below) although at that time, we only had a few reactions off that horizontal resistance level (roughly 1.065), whereas this most recent reaction helps to validate that resistance level.
The fact that the EUR/USD turned down from resistance, although seeming bearish, in no way dampens my expectation for a continued move higher in the Euro against the US Dollar. What that does is to help validate that level as resistance, which further increases the odds that if & when that level is taken out, the EUR/USD pair is likely to rally up to the first target level (T1) in the coming days or weeks. First things first, of course, and that would be to see the R1 level clearly taken out, even if we were to get several more failed attempts to do so. In fact, the more reactions off of a support or resistance level, the more “valid” and technically significant that level becomes.
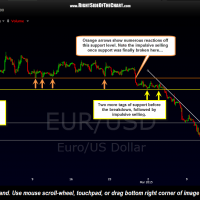
For example, the last chart below is a 120-minute chart of the EUR/USD going back to January. The orange arrows mark the numerous reactions off of the primary horizontal support level over that time period (about 1.127) with a secondary, more minor support somewhat below around the 1.115 level. Note the very impulsive selling that took out the orange primary support line towards the end of February. Prices went on to tag & then consolidate above the yellow support line (while digesting the recent move lower) before going on to break below that final support level, immediately followed by a relentless downtrend in the EUR/USD until recently.
-

- EUR-USD 60 minute March 16th
-
- EUR-USD 60 minute March 17th
-
- EUR-USD 120 minute March 17th
From here, I’ll be watching the price action on any further attempts for the EUR/USD to break above the R1 level. Of course, resistance is resistance until taken out so despite the recent breakout above the 60 minute bullish falling wedge pattern, we still don’t have an all-clear buy signal on the Euro/sell signal on the $USD. However, as when trying to identify a trend reversal, we just have to begin to build a case piece by piece & so far, the 60 minute bullish falling wedge breakout helps to provide some technical evidence for a reversal in the seeming bullet-proof rise in the $USD, or at the very least, a tradeable correction in a larger uptrend.
I typically don’t trade currencies, instead preferring to trade currency sensitive assets such as precious metals & mining stocks, hence the lack of official currency trade ideas. However, for those interested, I recently shared some of the comparable near-term price targets for FXE (Euro ETF) with a follower of the site yesterday. If interest in those charts, contact me I’ll be glad to forward those charts by email. Also note the new “Forex/Currency” category which can be found under the “Market Analysis” tab in the menu bar at the top of each page. Selecting that category will bring up all post related to currencies.