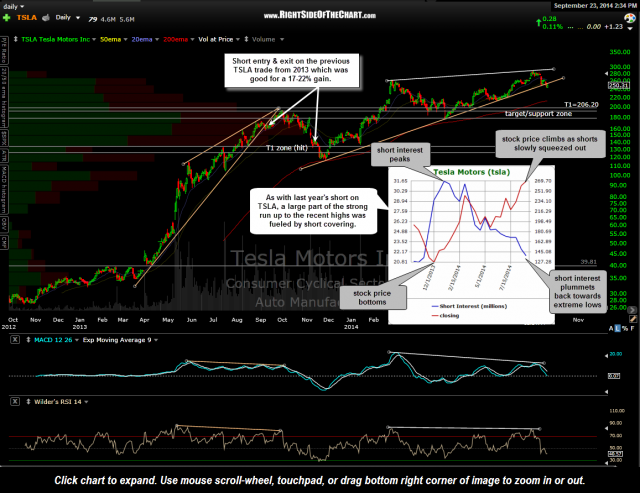
My notes & thoughts on TSLA virtually mirror the previous short trade on TSLA, just over a year ago today (which, fortunately, was the only other time I shorted this beast of a stock). TSLA was added as a short entry back then on Sept 13th, 2013 at 162.55 and went on to hit the top of the target zone for a 17.2% gain less than 2 months later and continued on to the bottom of the target zone for a 22% gain before reversing & continuing the bubble uptrend in the automaker.
The basis for this short trade, as back then, is the fact that TSLA has just recently broken down from a very large bearish rising wedge pattern, complete with bearish divergences on both the MACD & RSI. Also compare the short interest chart on this current daily chart with the short interest chart on the original daily chart from that previous post (click on the blue hyperlink above to open in a new window). As back then, the precipitous drop in short interest was undoubtedly a large driver in the sharp price increase in TSLA since the July 2013 lows as the short interest peak shortly after that and has continue to fall roughly inline with rise in the stock price.
As with that previous short trade, I have a target or support zone that I’m targeting on the stock although my current preference at this time is to cover just above the top of the zone, assuming that this trade pans out. Therefore, the sole & final target at this time T1 at 206.20. With TSLA currently backtesting the wedge from below following yesterday’s breakdown, the stock is offering a very objective short entry with a suggested stop over 265 (a 3:1 R/R) or lower.


