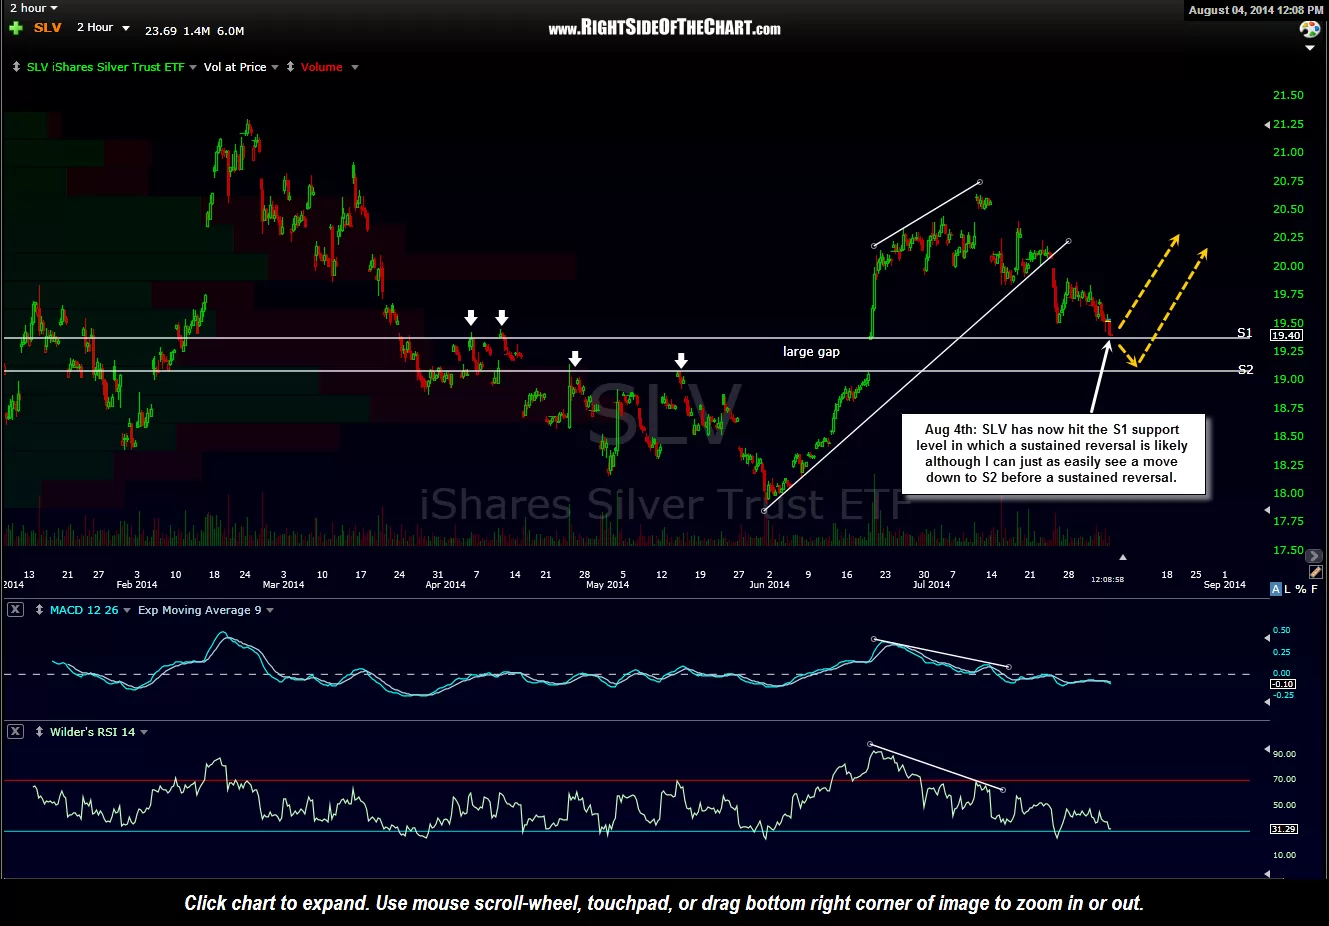
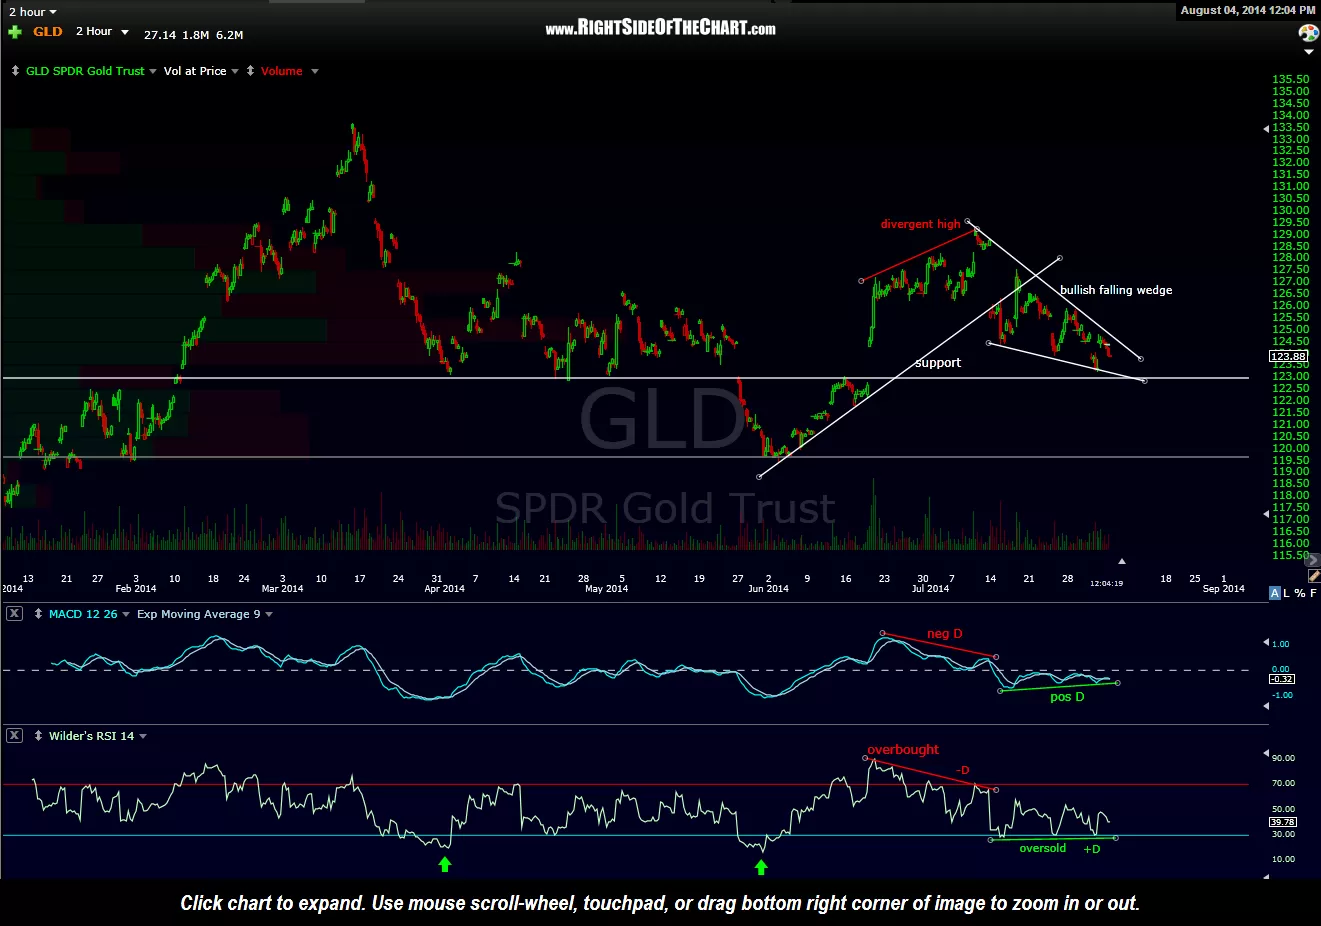
SLV (silver ETF) has now hit the S1 (first support) level as shown on the previous 120 minute chart while GLD (gold ETF) remains within the bullish falling wedge pattern just above its comparable horizontal support level. With SLV now at the S1 support level that I’m targeting and GLD approaching the typical breakout zone of the wedge pattern (usually around 70% +/- to the apex of the wedge), I continue to be on the lookout for an upside break above the pattern for the next buy signal in both gold as well as the miners, as they are likely to follow the metal. However, it wouldn’t surprise me to see SLV head down to the S2 level, especially if prices make a solid break & 120 minute candlestick close below the S1 level. If so, GLD would likely continue to move lower within the falling wedge pattern, quite possibly making a downside overthrow (break below) the bottom of the wedge before reversing and going on to break above the top of the pattern. The bearish scenario would be a solid break of the S2 level on SLV as well as the lower support level (lower horizontal line around 119.50-119.75) on this GLD chart.
-
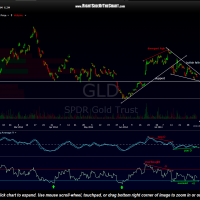
- GLD 120 Minute Aug 4th
-
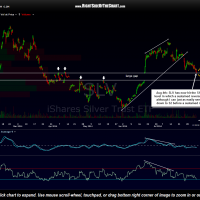
- SLV 120 minute Aug 4th