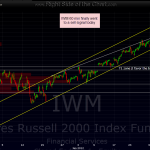
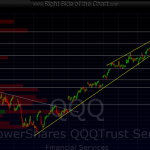
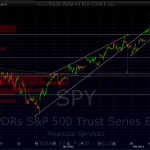
here are the updated 60 min charts for the SPY, QQQ, and IWM. my downside targets have not changed although i did add some minor support levels (S1, S2, etc..) which may or may not produce any half-decent bounces. once again, we have prices trading back below these key 60 minute uptrend lines but that follows several false breakdowns in the last few weeks so we’re probably getting the “Boy who Cried Wolf” scenario where market participants have been tricked so many times that they are now choosing to ignore the technicals. just like in aesop’s fable, will the wolf (bears) really come this time to eat all the sheep (bulls)? play it as you will but just don’t fall victim to the guise that the fed is in now in complete control of this market and has finally found a way to remove volatility from the stock market and continue to walk prices higher indefinitely. again, remember that although i will often post market commentary and charts, it is the individual stock and sector etf patterns, both long and short, posted here that are playing out very well lately and which are the primary focus of this site.
Results for {phrase} ({results_count} of {results_count_total})
Displaying {results_count} results of {results_count_total}


