
Barring a decent run-up into the close today, three of my short-term trend indicators will be on sell signals. Smaller monitors will have to pan & zoom to make out the detail on this quad-trend indicators screenshot (click on image to open first) but in looking closely at the daily S/T chart (bottom-right quadrant), you’ll see that the 20 day EMA recently turned lower (a very simple but relatively effective short-term trend indicator) & today we have bearish crossovers on both the 39/13 & 26/13 EMA pairs (shown via a red or negative cross below zero on the histograms). To help minimize whipsaws (false sell signals), it’s best to wait for the end-of-day closing values on all of these trending indicators.
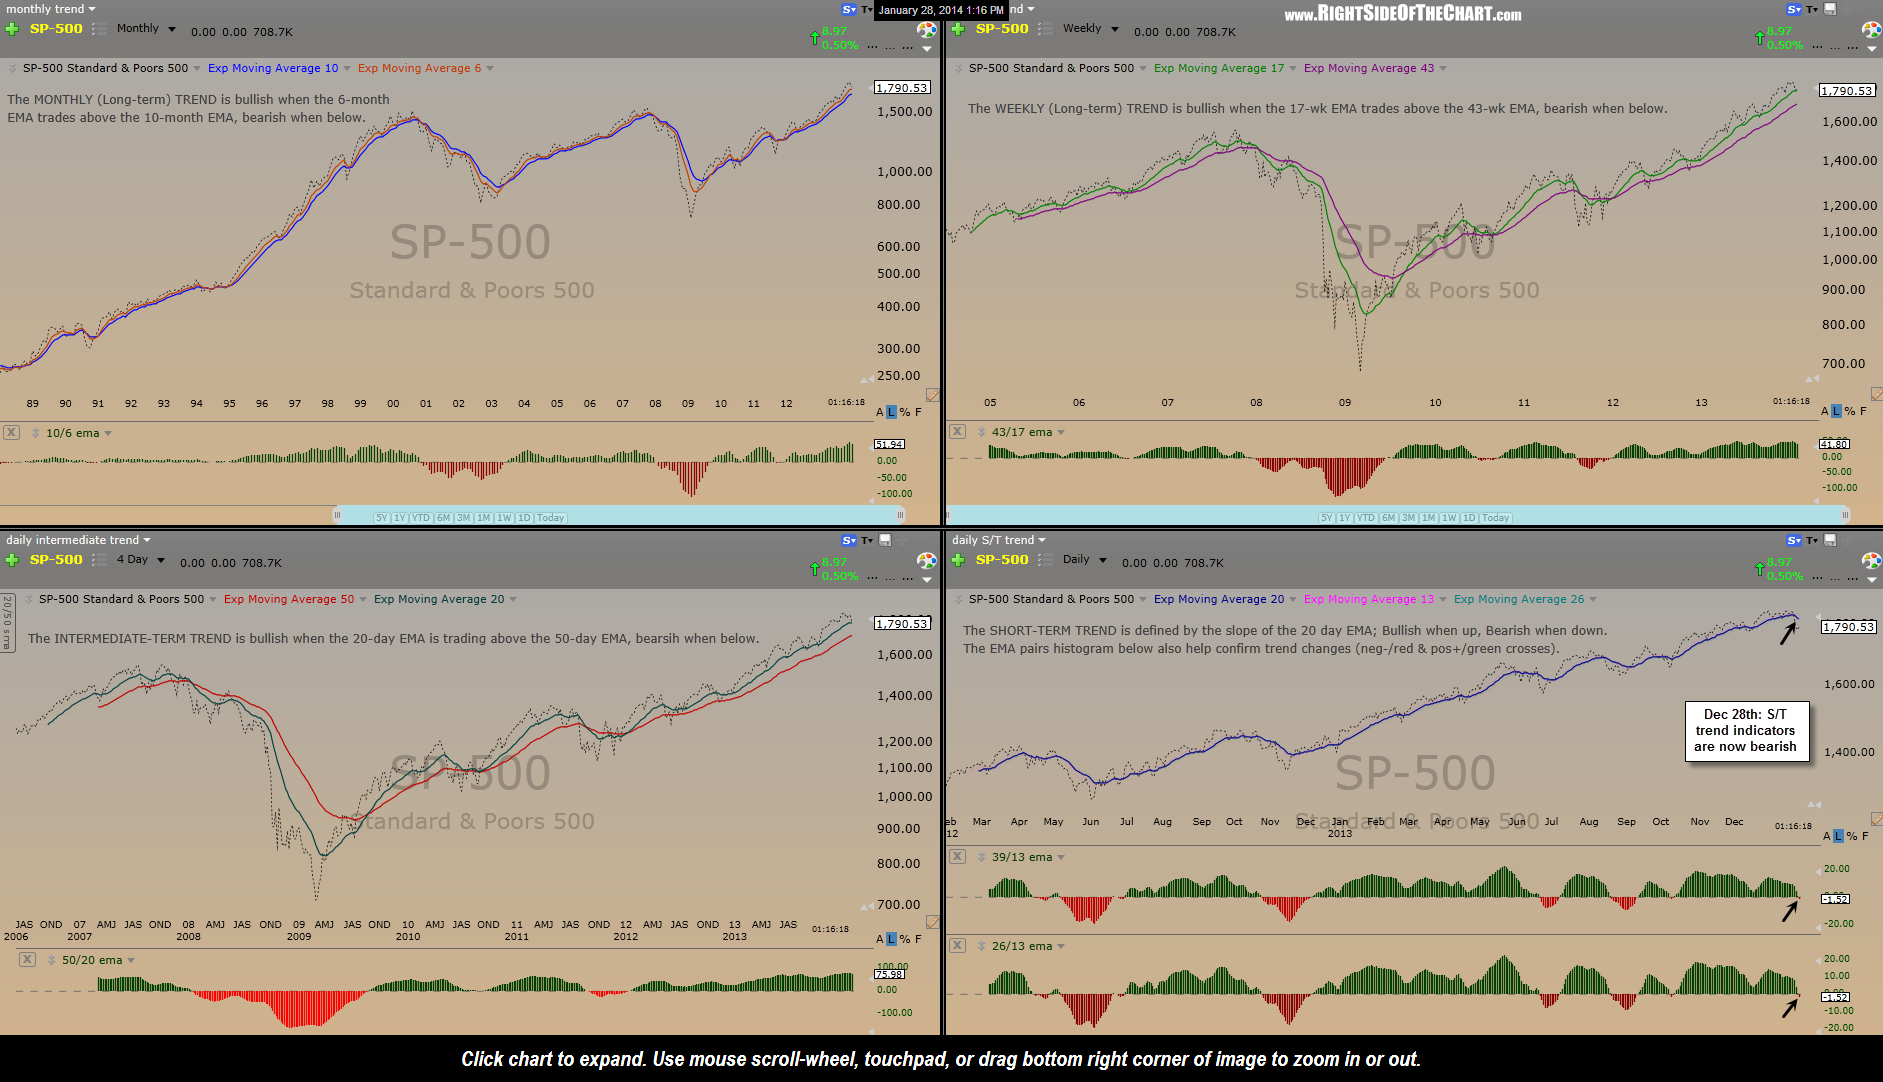
Quad Trend Indicators Jan 28th
Long-term traders & investors need not be overly concerned with the short-term trend, other than maybe used as an aid to determine when to hold off on adding new long exposure, raising stops, booking partial profits or hedging. The daily intermediate-term trend, defined by the posture of the 50/20-day EMA pair, and the weekly long-term trend (43/17 pair) are very useful to active traders as well as longer-term investors for determining the overall trend with relatively infrequent but fairly accurate trend change signals. As of now, the intermediate & long-term trends all remain comfortably in bullish territory.