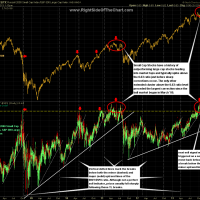
 This is an updated version of the $SPX:$RUT (Ratio of performance between the S&P 500 Large Cap Index and the Russell 2000 Small Cap Index) that was posted earlier this month. In that previous chart, I noted how spikes to or above the 0.63 ratio (red arrows) have historically preceded sharp sell-offs in the broad market. I’ve added some additional notes and trendlines to this updated $SPX:$RUT chart noting how the ratio seems to move up in a series of minor uptrend lines (dashed) above major (solid) uptrend lines and that a breakdown of the ratio below either will typically give an early sell signal for the broad market. With the small cap stocks starting to underperform the broad market in the most recent trading sessions, I am watching for a solid move back below the 0.63 ratio as well as a break below the current minor uptrend line, both of which could come as soon as today.

