
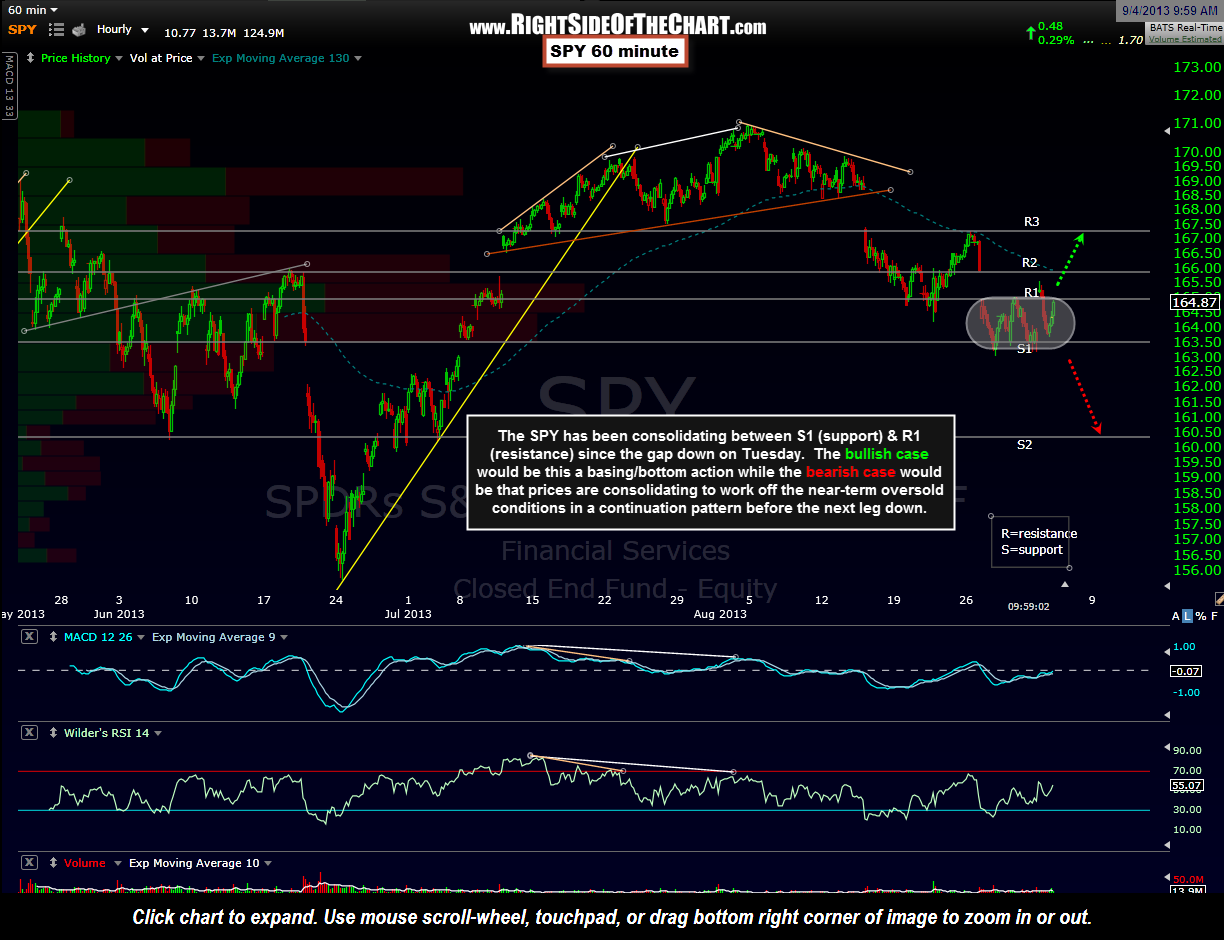
 The SPY has been consolidating between S1 (support) & R1 (resistance) shown here on the 60 minute chart since the gap down on Tuesday. The bullish case would be this basing/bottom action while the bearish case would be that prices are consolidating to work off the near-term oversold conditions in a continuation pattern before the next leg down. Although not picture-perfect, this recent consolidation could almost be viewed on the 4-hour & daily charts as a bear flag (continuation) pattern. Regardless, a solid downside break below this recent consolidation range would likely portent more downside to come while a break above the R2 level would likely bring prices to at least the R3 level.
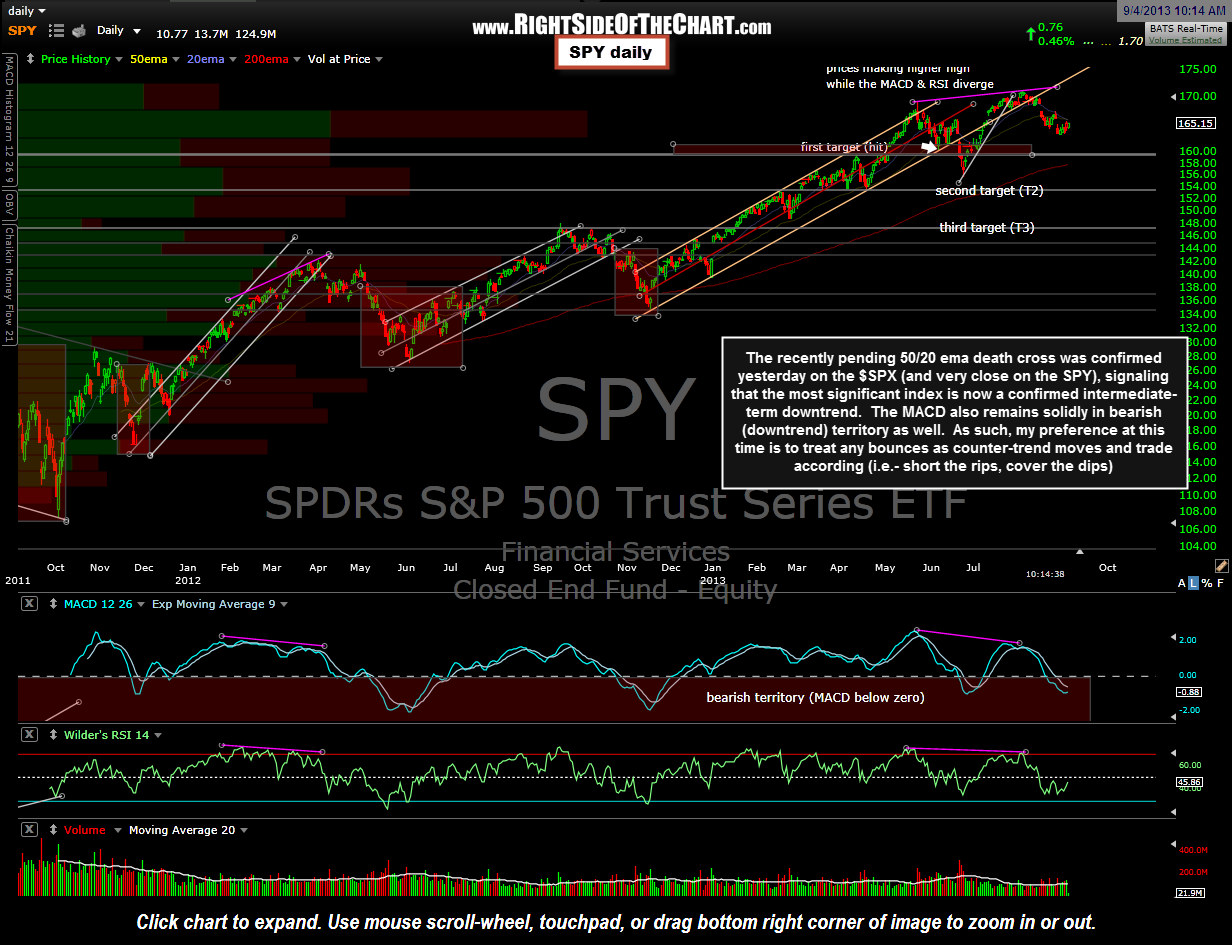 However, although the intraday charts can be useful for timing entries & exits on positions, my primary focus remains on the longer-term charts (daily & weekly) at this time. I’ve been extremely preoccupied working with my programmer on the site and in doing so, missed the fact that the previously discussed pending 20/50 ema death cross was indeed made official at the close yesterday (on the $SPX, with the SPY 20 ema closing fractionally above the 50 ema but currently trading below). No stand-alone indicator is prefect but this fairly reliable intermediate-term trend indicator, taking together with the other bearish technicals recently discussed, helps to confirm that the intermediate-term trend in the market is now bearish and until/unless these signals are reversed, my preference is to consider any rallies as counter-trend moves and position accordingly (i.e.- sell/short the rips and cover the dips). SPY daily chart above.