
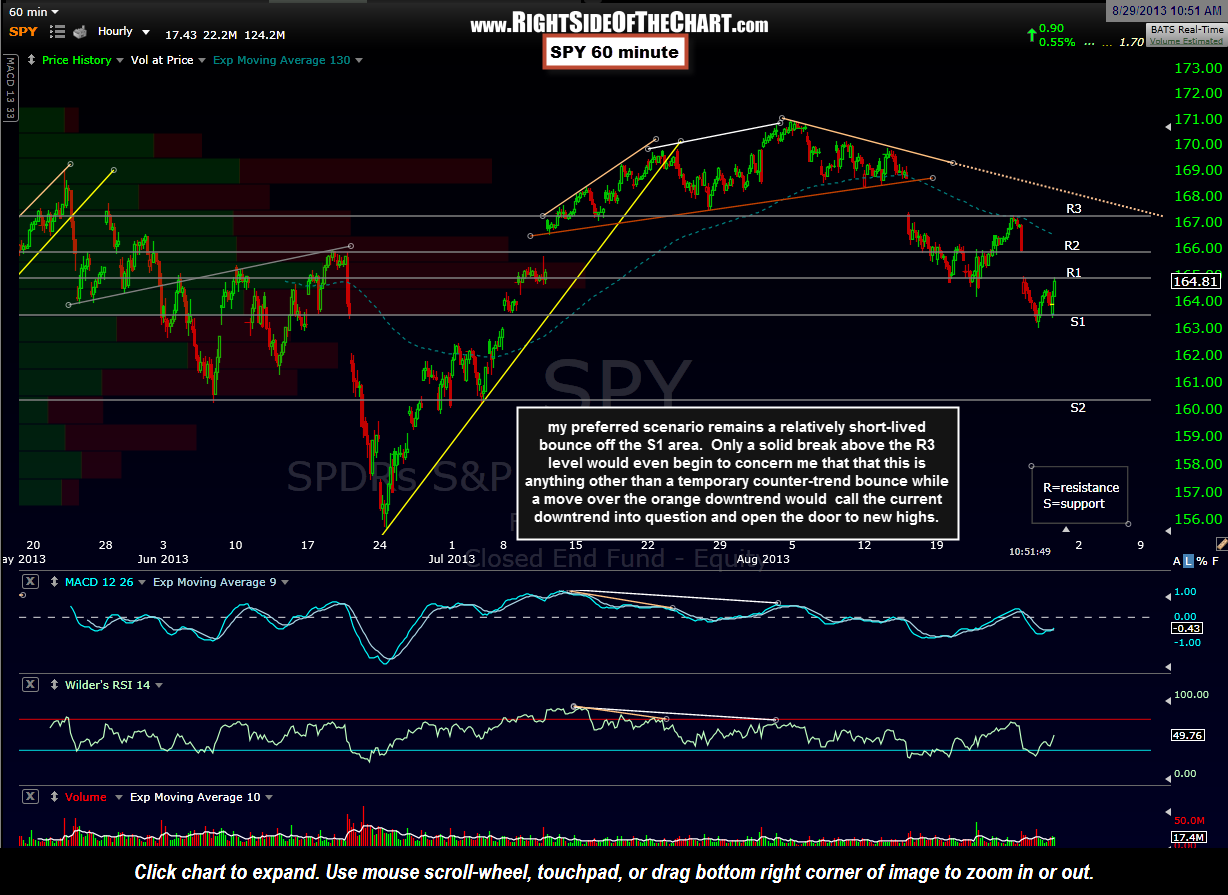
 My primary scenario remains that this is only a temporary bounce off the aforementioned support level on the 60 minute SPY chart with a resumption of the downtrend likely to begin very soon. I’ve added some key overhead resistance levels (R1-R3) and we are current at the first resistance level as I type, which is defined by the bottom of Tuesday’s gap. R2 comes in a the top of the gap with R3 around the bottom of the August 15th gap down that put in the likely island reversal cluster pattern. Only a move above the orange downtrend line shown here would call the current downtrend into jeopardy and open the door to new highs in the SPY/$SPX.
My analysis is predicated not only on the recent price & volume action but more so on many other factors discussed over the last several weeks such as the AAII bull/bear extreme readings, deteriorating market breadth, the technical breakdowns of many leading mega-cap stocks, record low shorting interest and other extreme complacency reading and most importantly, the longer-term charts (daily & weekly time frames, which can be referenced under the General Market Analysis category as well as clicking on any of the blue $SPX/SPY tags as found at the bottom any related posts or in the Posts By Symbol drop-down box on the right hand side of the home page). Updated 60 minute chart shown above.