 At the risk of jumping the gun on a pending signal that’s not yet confirmed, I’d rather point this out in advance vs. after the fact in order to give traders a heads-up. Until recently, I was focused largely on the intraday charts, particularly the 15 minute SPY chart, in order to get an early “jump” on a likely trend reversal. However, as recently stated, my focus has now turned to the longer-term time frames… specifically the 60 minute thru daily charts. Some of the reasons for a shift in the time-frame focus were discussed in the recent “The Charts are Stacked” post.
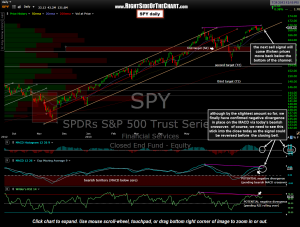
For weeks now, I have been discussing the pending negative divergences that were forming but not yet confirmed on the SPY daily chart. As of now, that divergence has been confirmed via a bearish crossover on the MACD as well as the RSI starting to roll over. Keep in mind that when using signals on daily charts, it is typically only the closing values that count. Therefore, this “confirmed” divergence will really only be confirmed (or not) at the 4pm market close today.
I put a heavy weighting on clear divergences, positive or negative, when trying to identify likely trend changes. Although they are not the be all end all in technical analysis, clear and mistakable divergences, especially when present on multiple indicators and aligned with other confirming technicals such as bullish or bearish chart patterns, more often than not precede significant trend changes. Those trend changes are typically commensurate with the time frame of the chart in which they appear. For example, a breakout of bullish falling wedge pattern on a 15 minute chart with positive divergences might be useful for long trade lasting several hours to several days. Therefore, such a pattern might interest a very active short-term swing trader while solid negative divergences on the daily time frame might play out for a downside correction measured in weeks to even months.
On the updated SPY daily chart above, I have pointed out the current bearish crossover on the MACD (best viewed by the -0.01 reading on the MACD histogram) as well as the next sell signal on that time frame which would be a break below the orange ascending channel. From there, I still have the daily short & intermediate-term trend indicators which need to move from the current “uptrend” status to “downtrend” status, which I will share if & when they do. However, based on my analysis of the charts coupled with the current multi-year low in short interest, record high margin balances, and recent extreme bullish sentiment reading, I do think that the odds of a substantial correction is equities is quite high right now.

