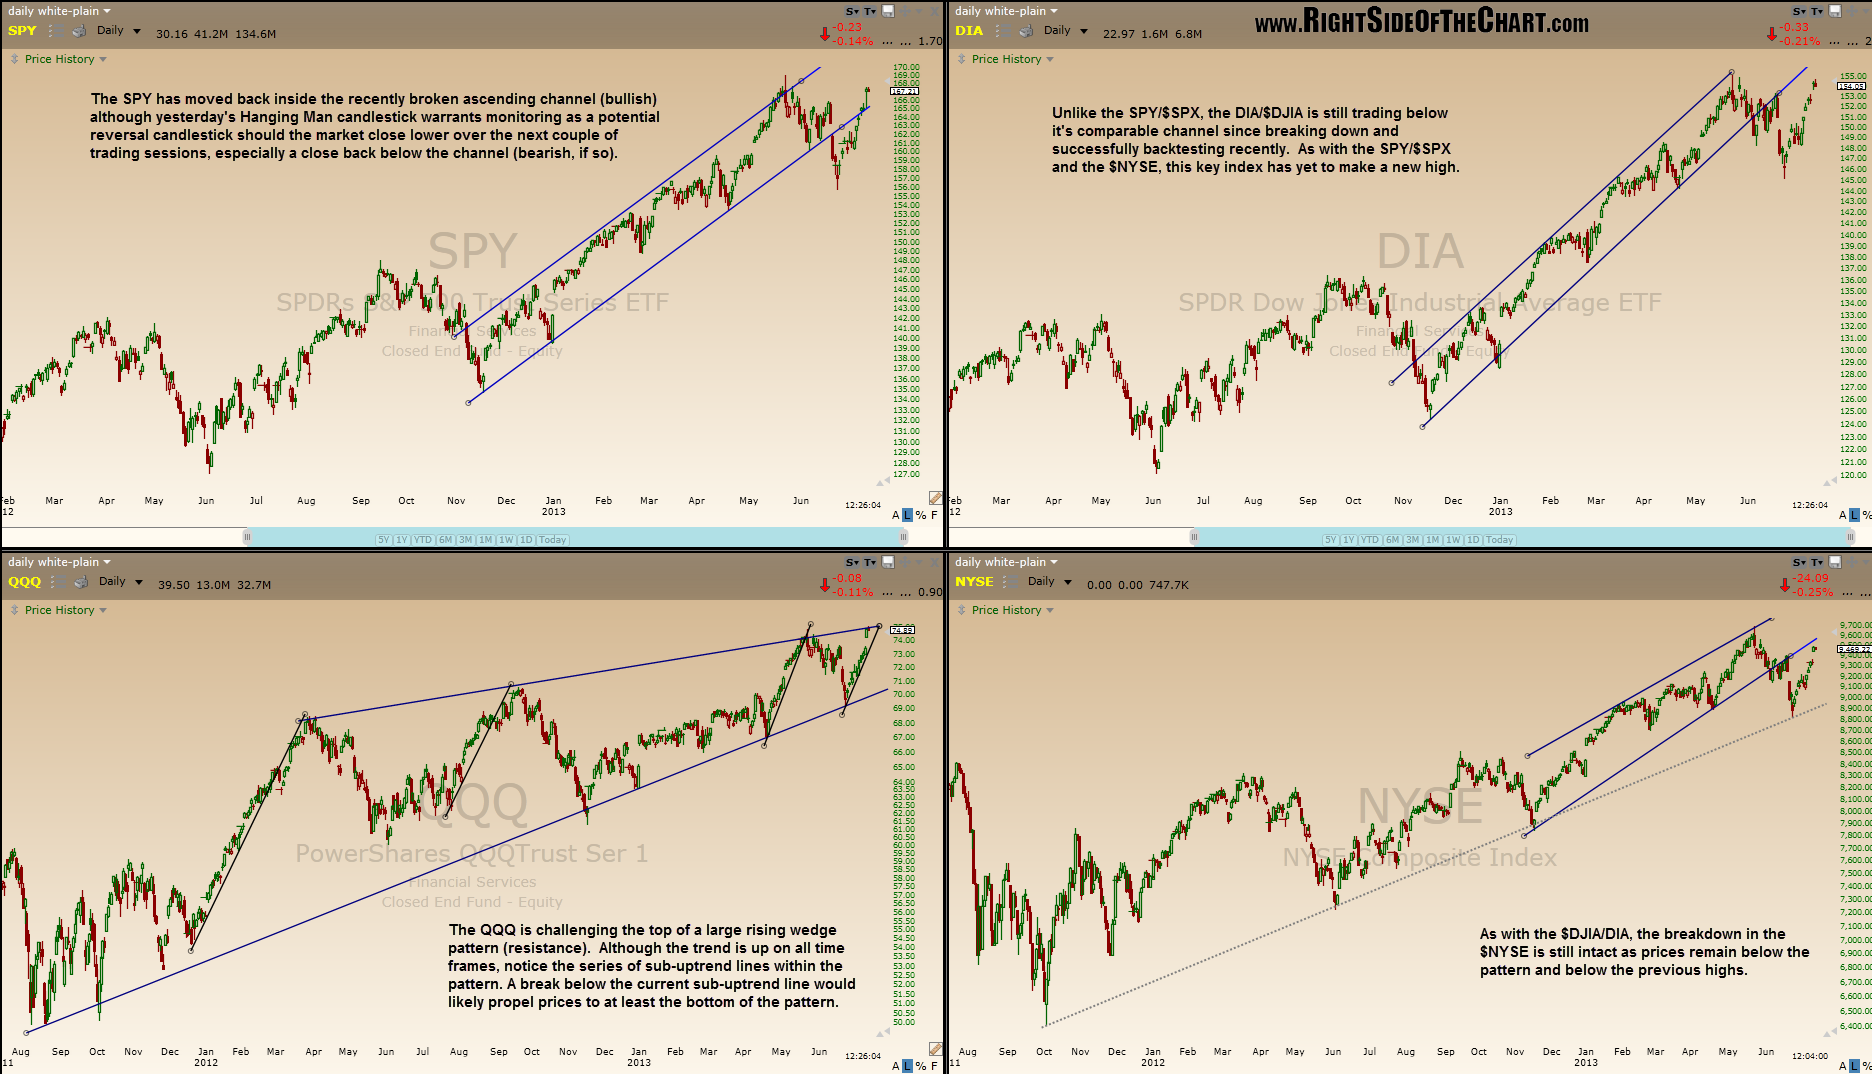
Here’s a quick visual overview of four major indices (or their respective tracking ETF’s). Included are the daily charts of the SPY, QQQ, DIA and the $NYSE. In order to include all four charts from this layout, I saved the image in larger than usual format. As always, once you click any image on the posted on RSOTC.com you have the ability to zoom in & out using a touchpad, scroll-wheel, or by dragging the dotted triangle pattern in the lower right corner of the image. Tablets and phones can use the pinch-to-zoom feature as well.

