
QQQ has just hit the downtrend line highlighted in today’s video (60-minute chart), where a reaction (pullback) to at least the 599ish support is likely, IMO, while any solid & sustained breakout above the trendline would increase the odds of additional upside (I need to re-fit those overhead resistance levels).
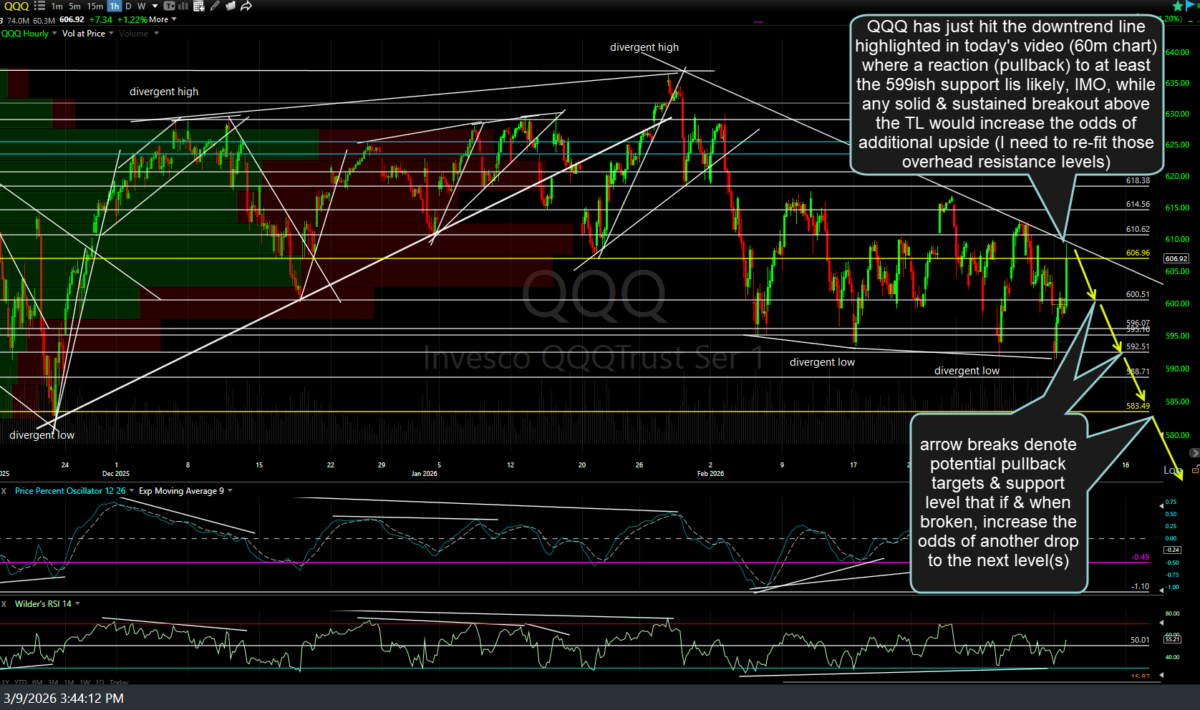
QQQ 60m March 9th
Arrow breaks denote potential pullback targets & support levels which, if & when broken, increase the odds of another drop to the next level(s).