
Following the sell signal (60-minute bearish rising wedge pattern breakdown) highlighted on Friday, /SI (silver futures) has hit the first price target on that 60-minute time frame (the secondary uptrend line) & now offers an objective re-entry, add-on, or new short entry on this backtest of that trendline from below. Previous (Friday’s) & updated 60-minute charts below.
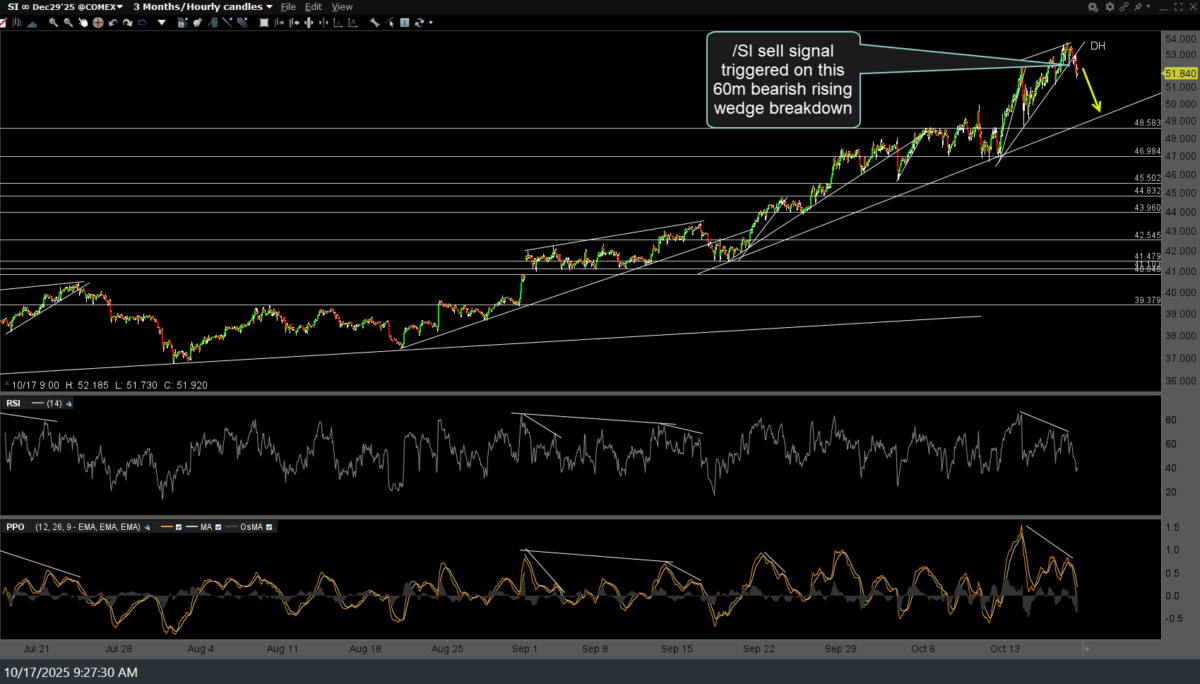
SI 60m Oct 17th
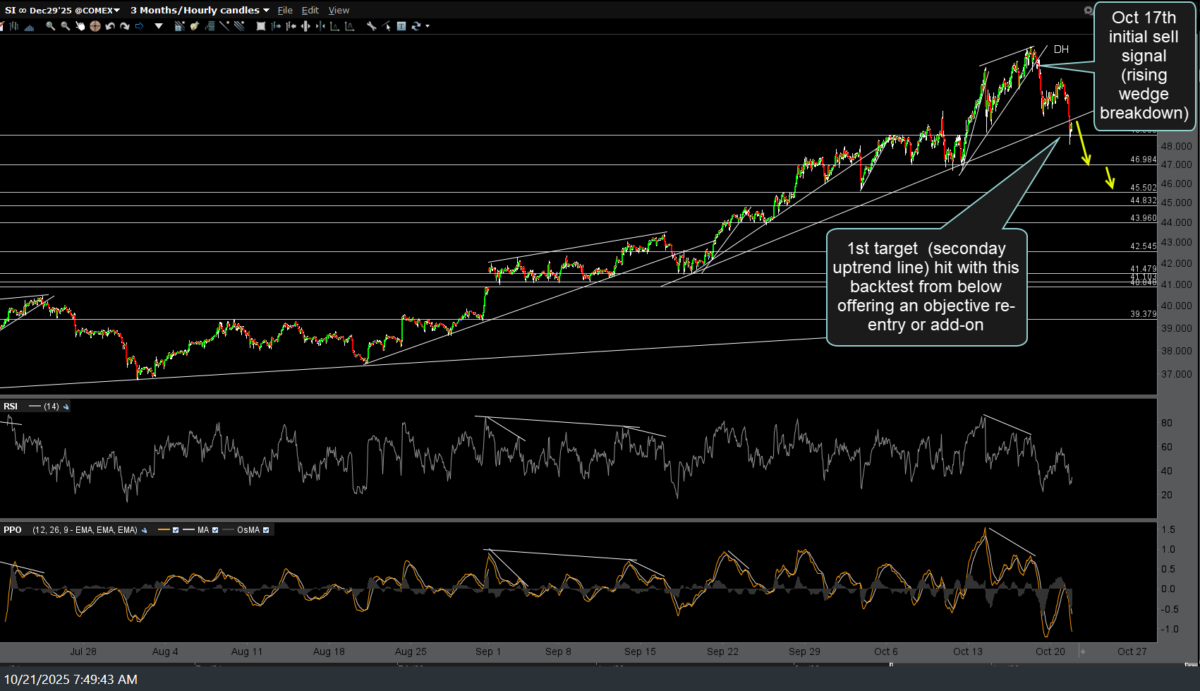
SI 60m Oct 21st
Zooming out to the daily time frame, SLV (silver ETF) has now triggered the sell signal I’ve been waiting for on the daily time frame since Oct 10th (first chart below) with a solid break below the uptrend line off the Sept 17th lows, in addition to the high-level PPO bearish crossover I was looking for, assuming both stick in the regular session and/or the close of trading today. Previous & updated daily charts (with today’s pre-market trading shown by the white candle) below.
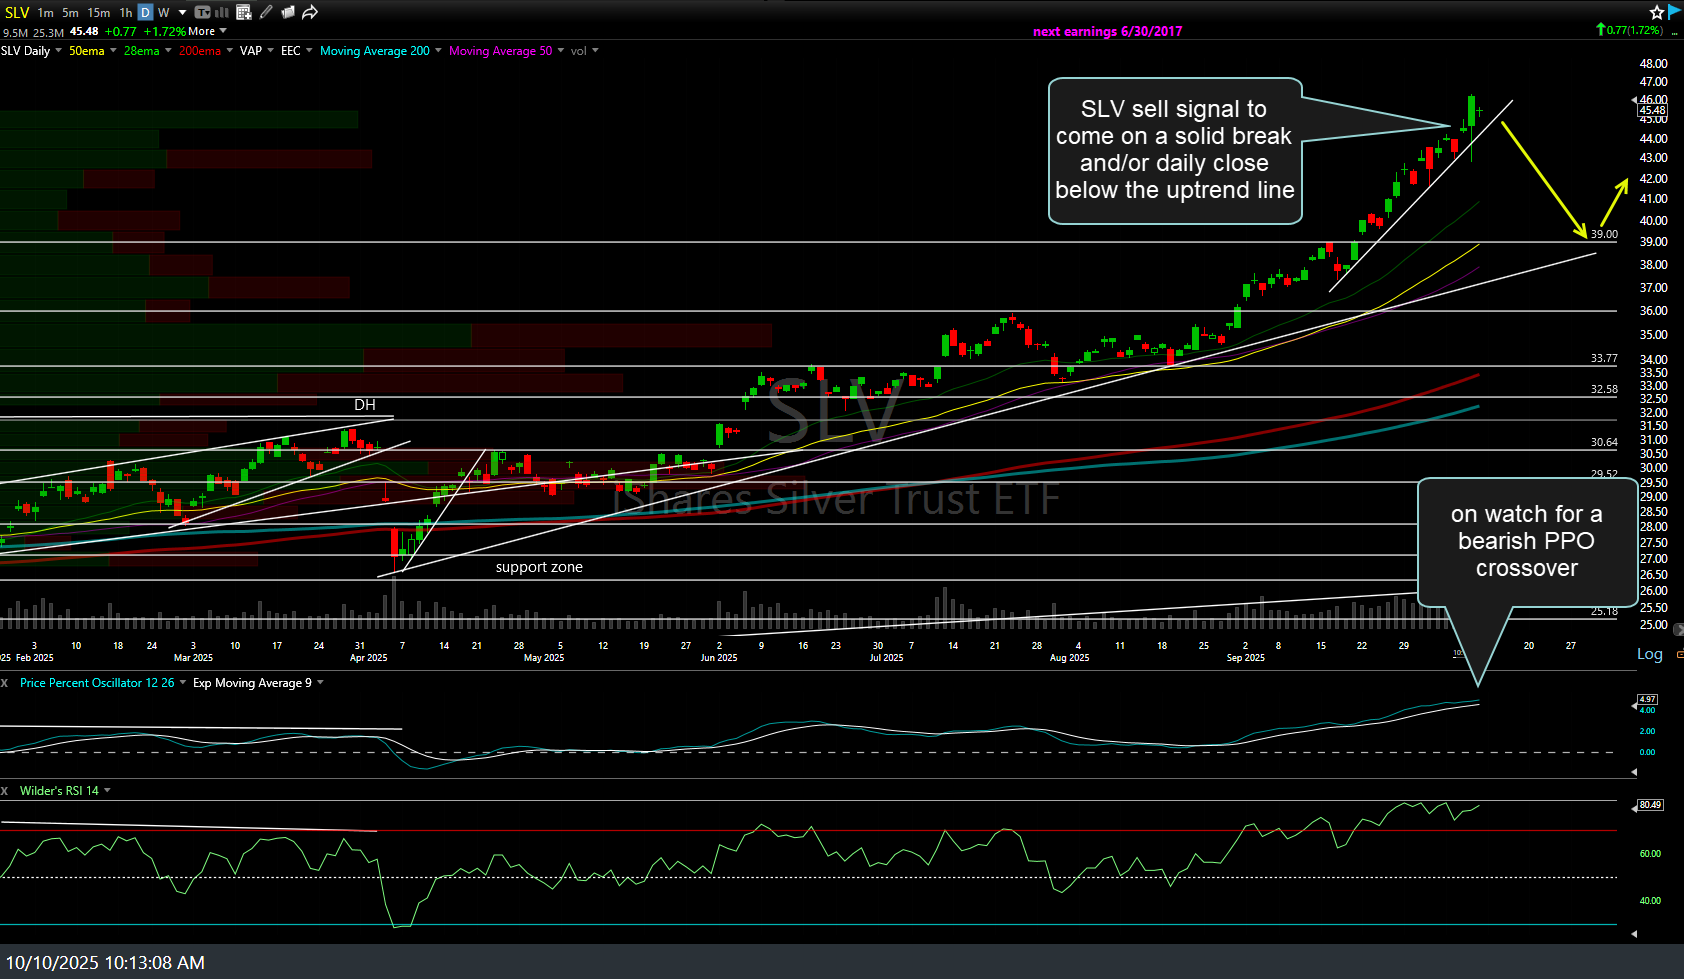
SLV daily Oct 10th
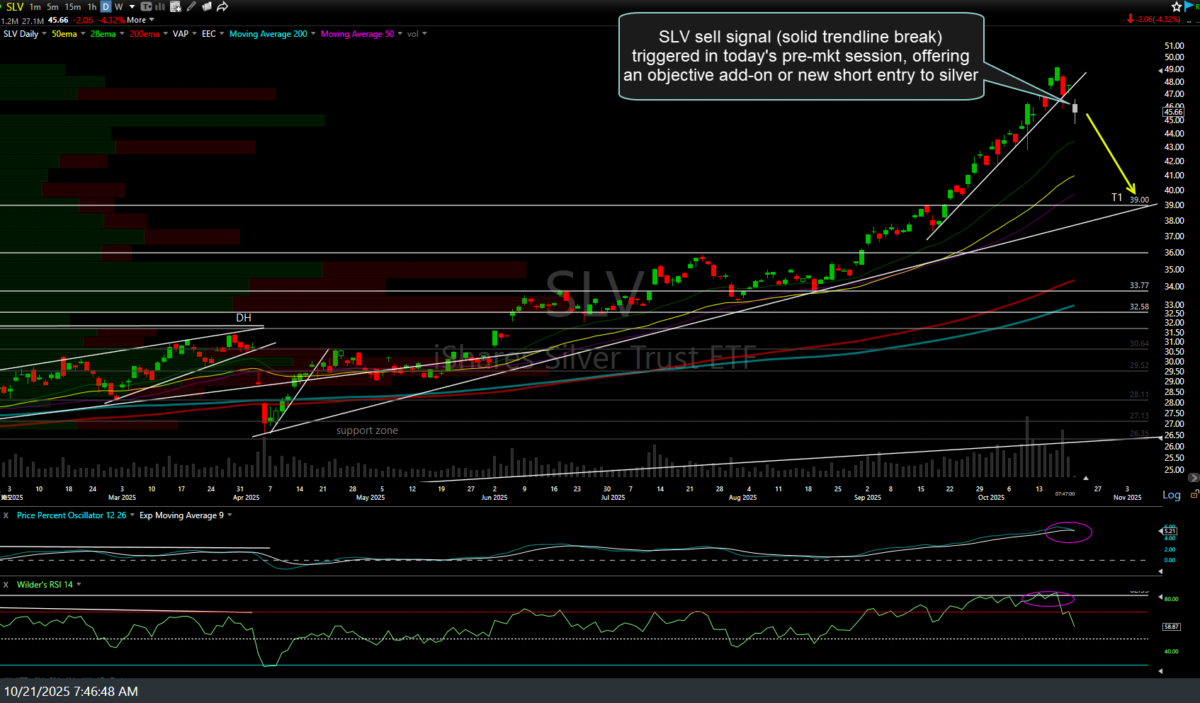
SLV daily Oct 21st
Keep in mind that I often post different price targets for the same (or related) security on multiple time frames, typically with more targets for active traders on the 60-minute or other intraday time frames for more active swing traders & price targets for typical (less active) swing traders on the daily or weekly time frames. I may also post charts of both the futures & ETFs that track the same index or commodity with similar but often slightly different price targets, since most futures contracts trade around the clock & therefore, have more candlesticks & reaction points, quite often showing different price & trendline support levels.