
This early-session (post-opening) snapback rally following yesterday’s sell signal (minor TL/wedge breakdown) provides an objective short add-on or new entry on /NQ & QQQ. Previous (yesterday’s) & updated 60-minute charts of /NQ (Nasdaq 100 futures) below.
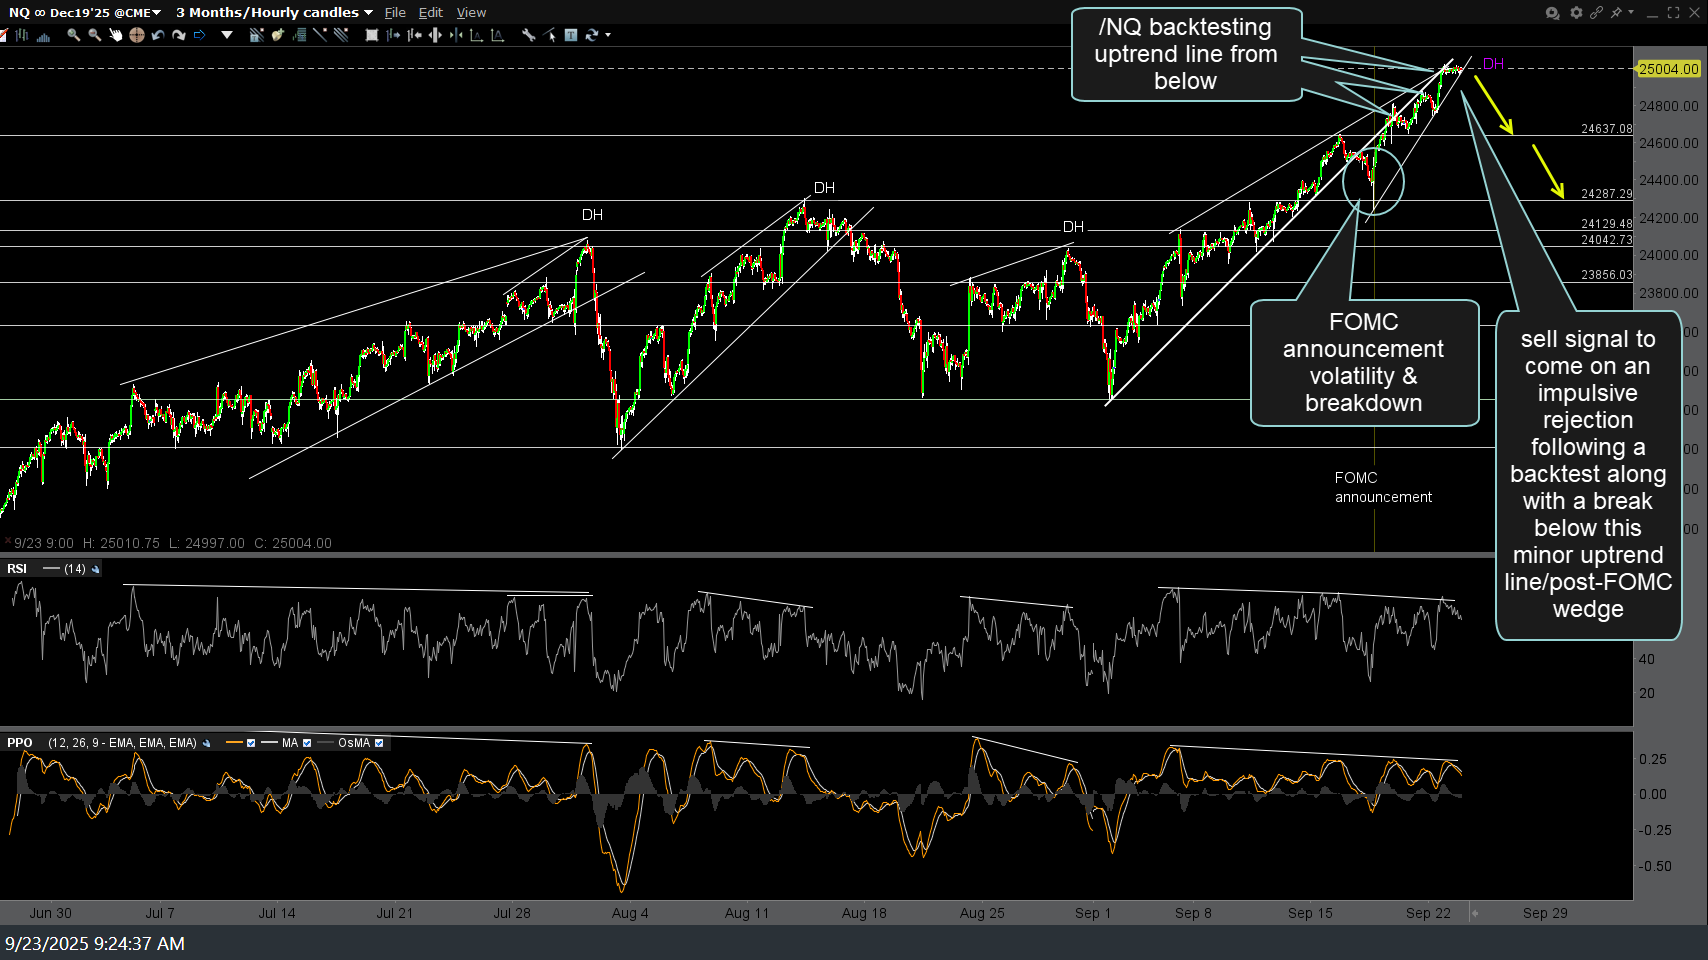
NQ 60m Sept 23rd
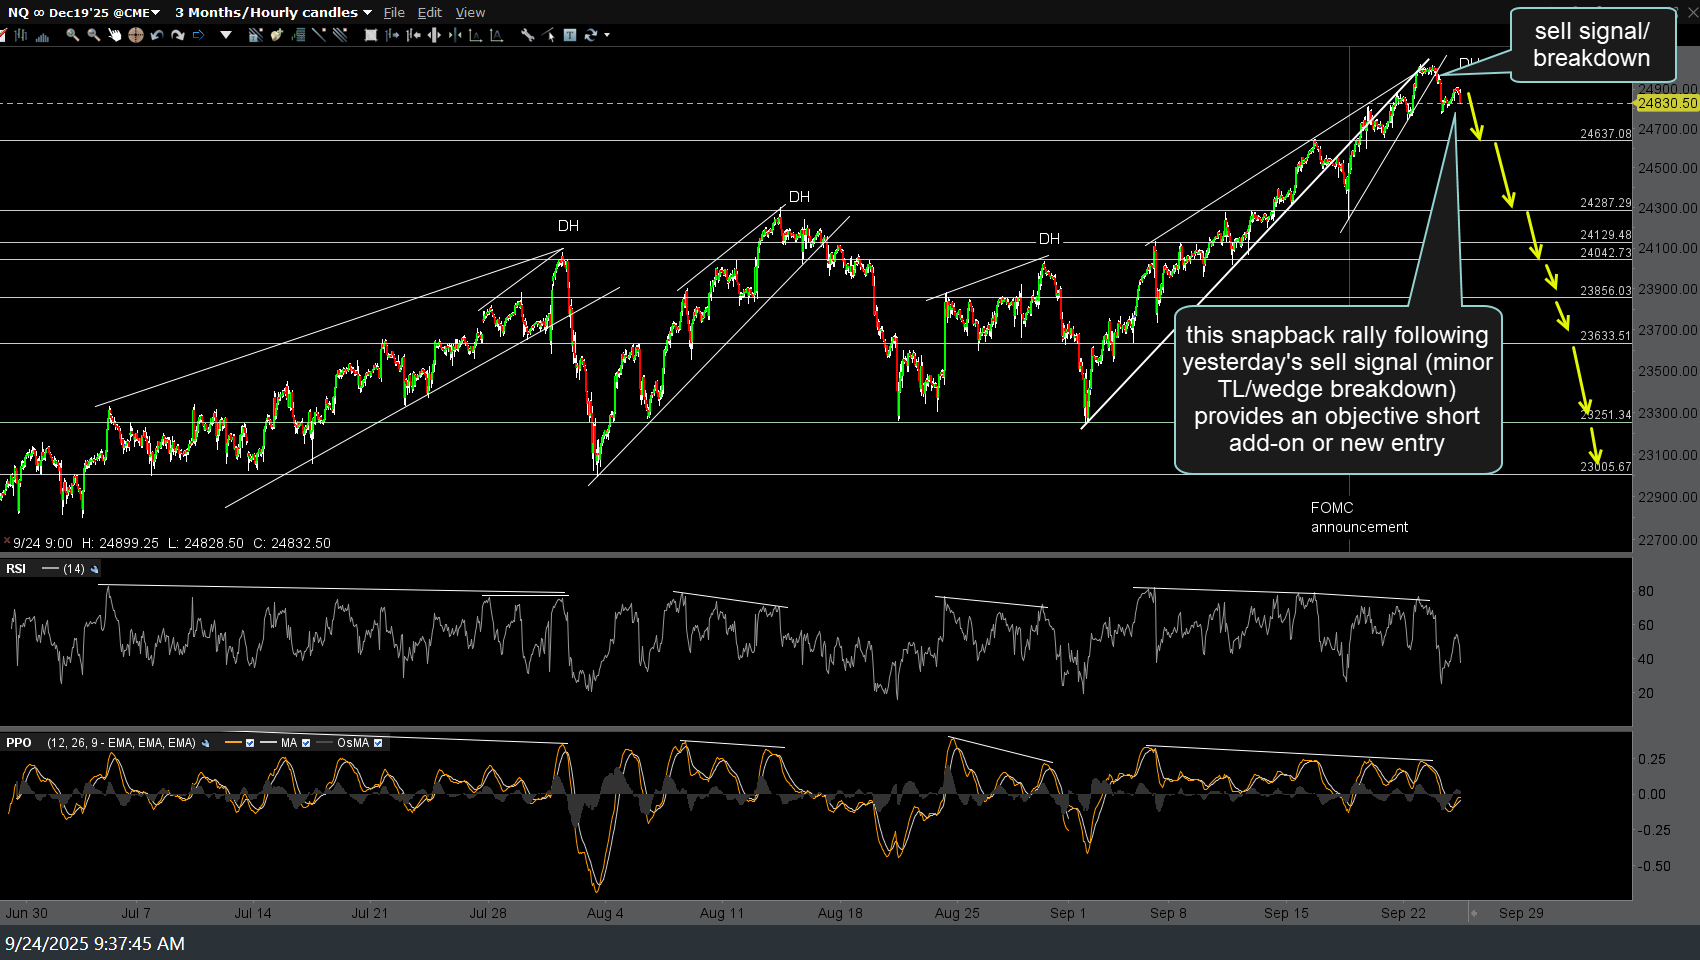
NQ 60m Sept 24th
Yesterday’s & today’s updated QQQ 60-minute charts, for ETF traders, below:
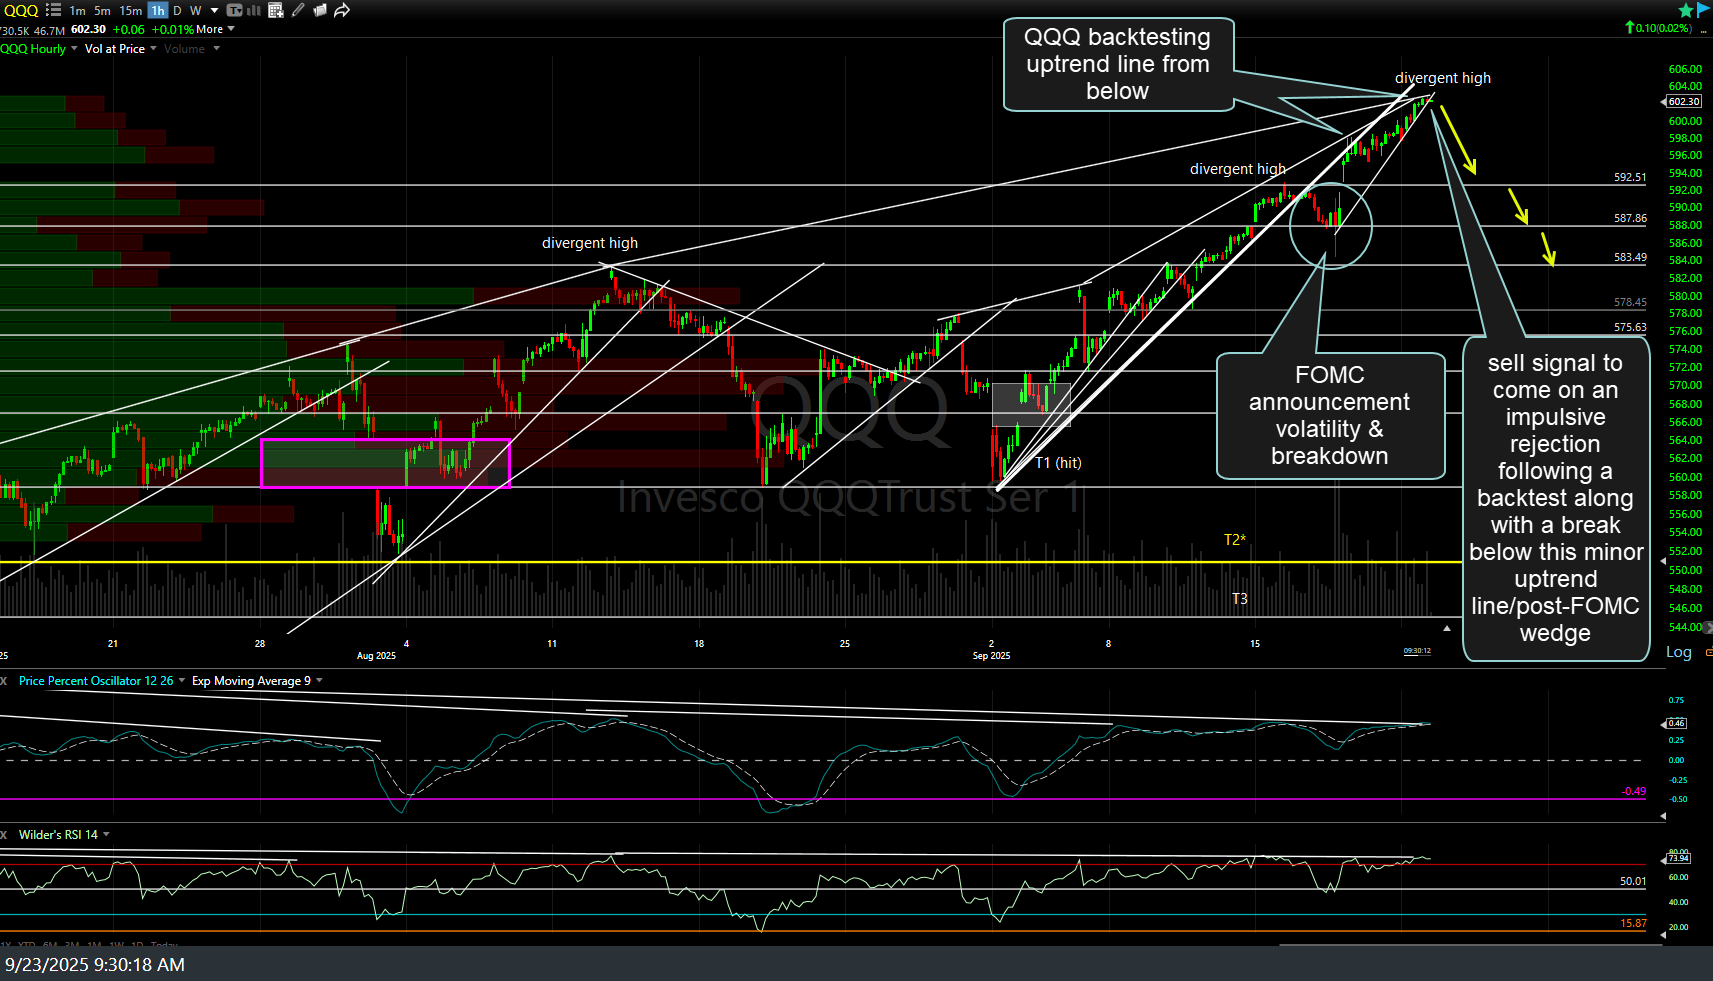
QQQ 60m Sept 23rd
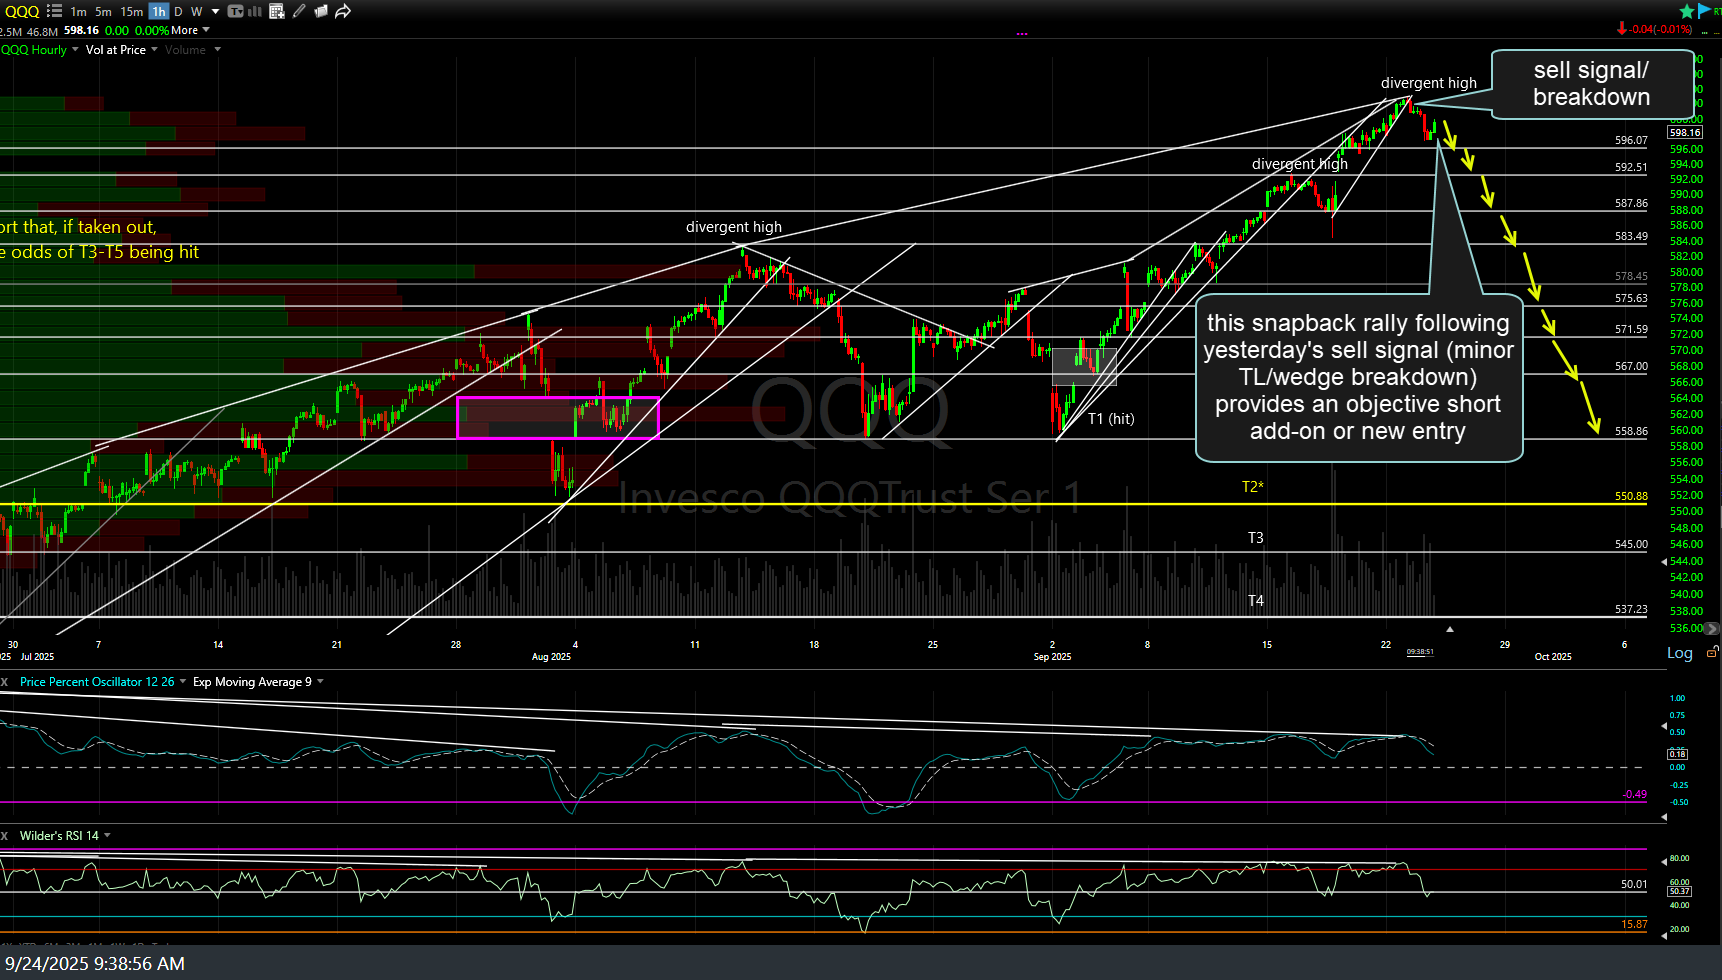
QQQ 60m Sept 24th
At the other end of the spectrum (from the mega-cap heavy Nasdaq 100, with top components like the $4.5T NVDA), IWM (Russell 2000 Small-cap Index ETF) is currently testing its multi-year all-time high triple-top resistance with a sell signal (for a long-term swing/trend trade) to come on a solid break and/or weekly close below this uptrend line off the early April lows. Of course, a case can be made to short here at resistance with negative divergences & oversold conditions.
Additionally, should IWM break above this resistance level, a sell signal would also come if the breakout clearly fails, especially in conjunction with a weekly close below the uptrend line & solidly back below the 245ish price resistance. Weekly chart, with longer-term swing/trend price targets denoted at the arrow breaks, below.
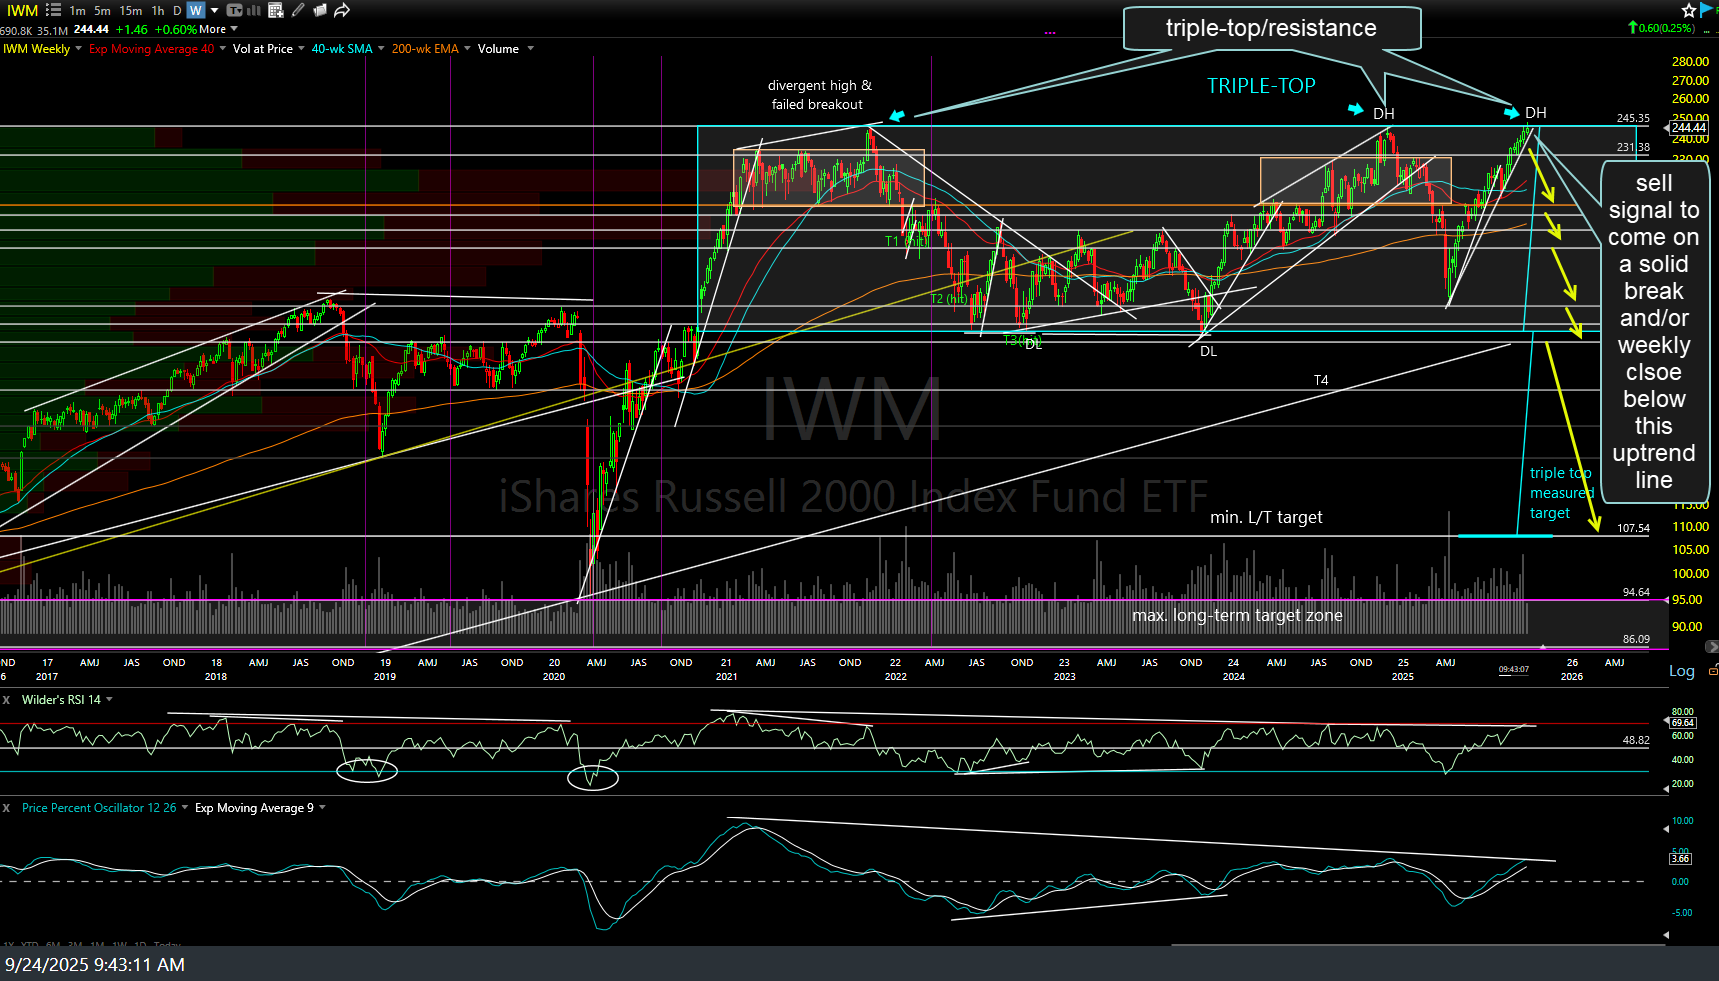
IWM weekly Sept 24th
Zooming down to the 60-minute chart, a sell signal for more active swing traders will come on a solid break and/or 60-minute close below the minor uptrend line in IWM.
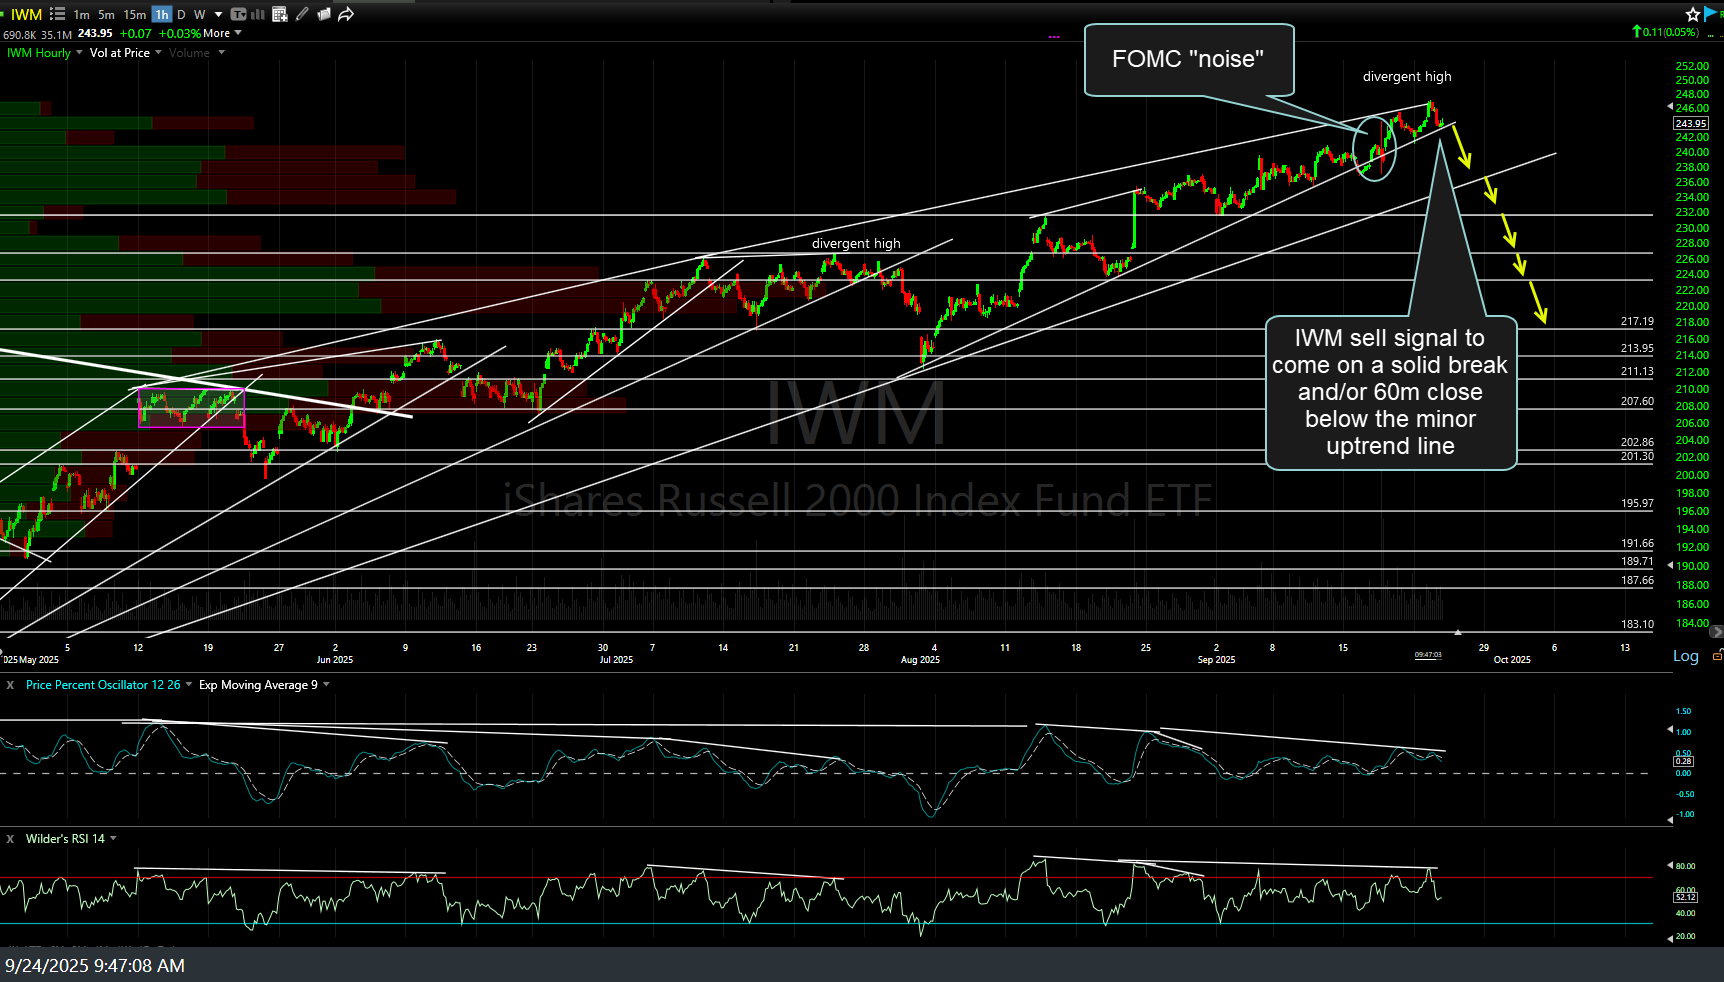
IWM 60m Sept 24th