
With QQQ now within 2% of the top of my ‘market top range’ first posted back on June 26th, with the top of that range still the ideal reversal point (in order to align my price targets with the Fibonacci retracement levels when measured off the Oct 2022 lows), I’ve also marked up a daily chart with some long-term swing & trend targets for /NQ (Nasdaq 100 futures) below.

NQ daily July 10th
The comparable max. upside & ideal reversal point for /NQ (in order to align the Fibs with my price targets) also comes in around 2% above current levels to around the 21200 level. The /NQ price targets with an asterisk also align with key Fib retracement levels when measuring the rally off the Oct 2022 lows, as with many of my QQQ long-term targets. Whether on not the current trend reverse on or around these levels only time will tell but as I stated when I first posted that 511ish end-point for the rally a couple of weeks ago, I suspected it would only take the market a week or so to get there and as such, one potential scenario (and trading plan, for those interest) would be to see a nice pop on tomorrow’s dual Jobs & Inflation (CPI) reports that takes the Q’s closer to that level, followed by a reversal.
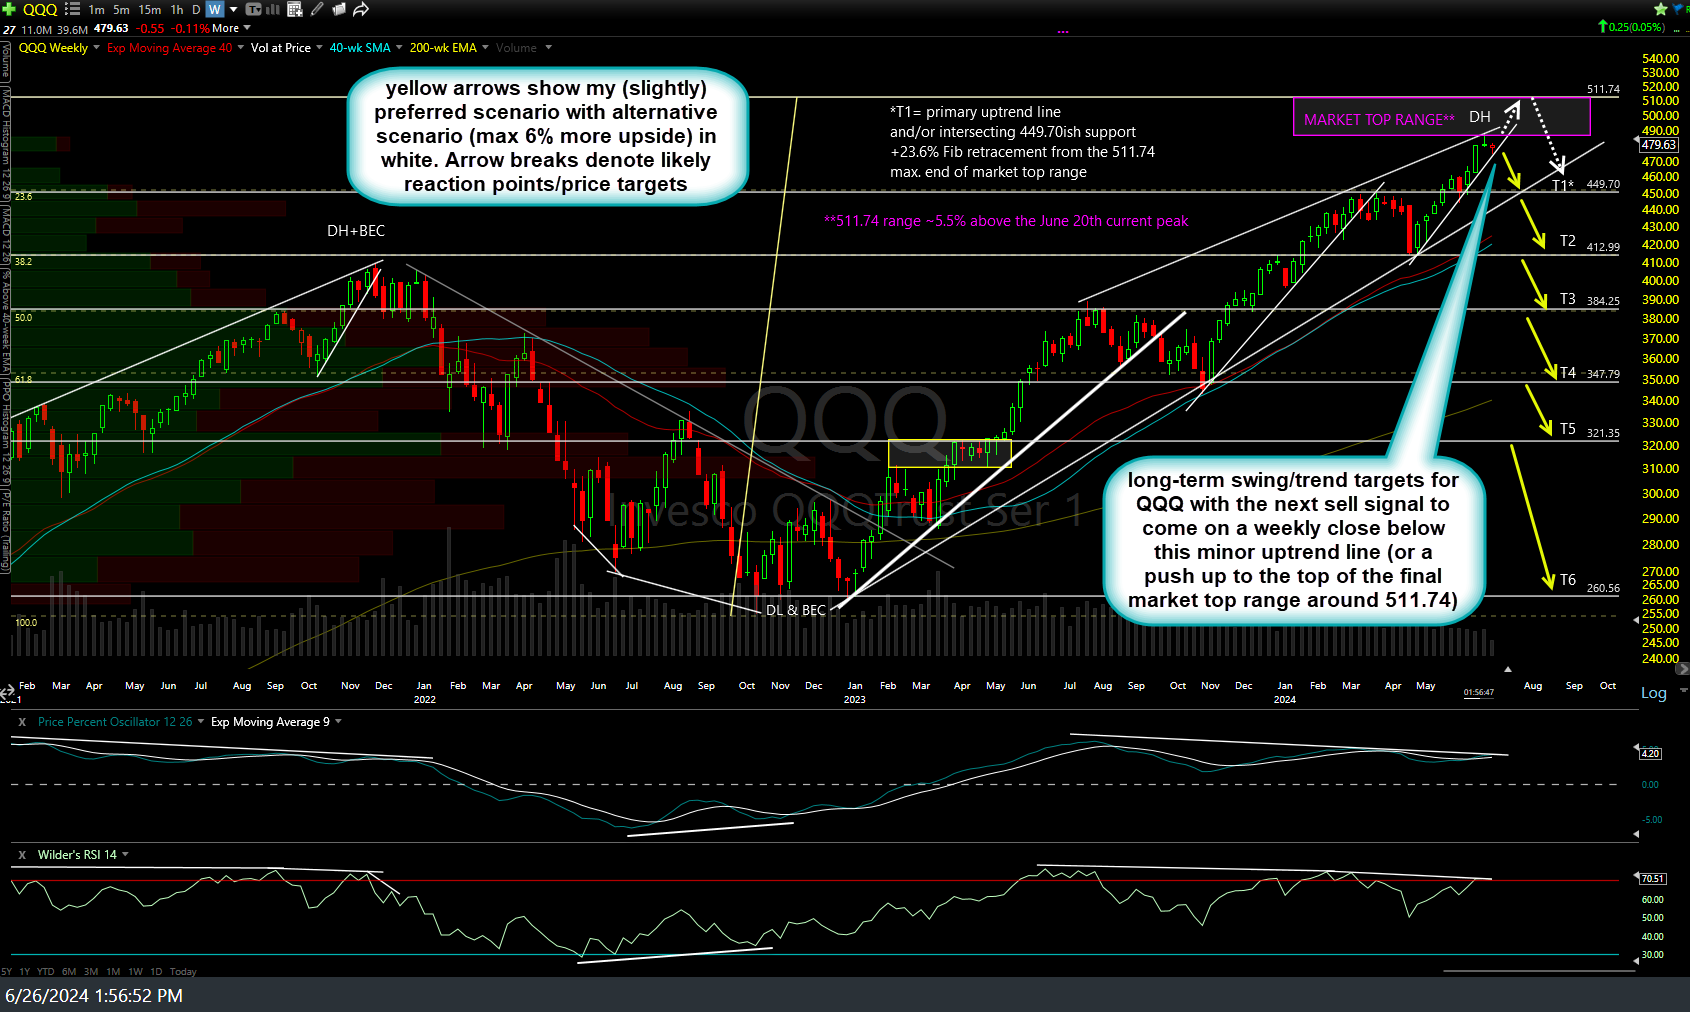
QQQ weekly June 26th
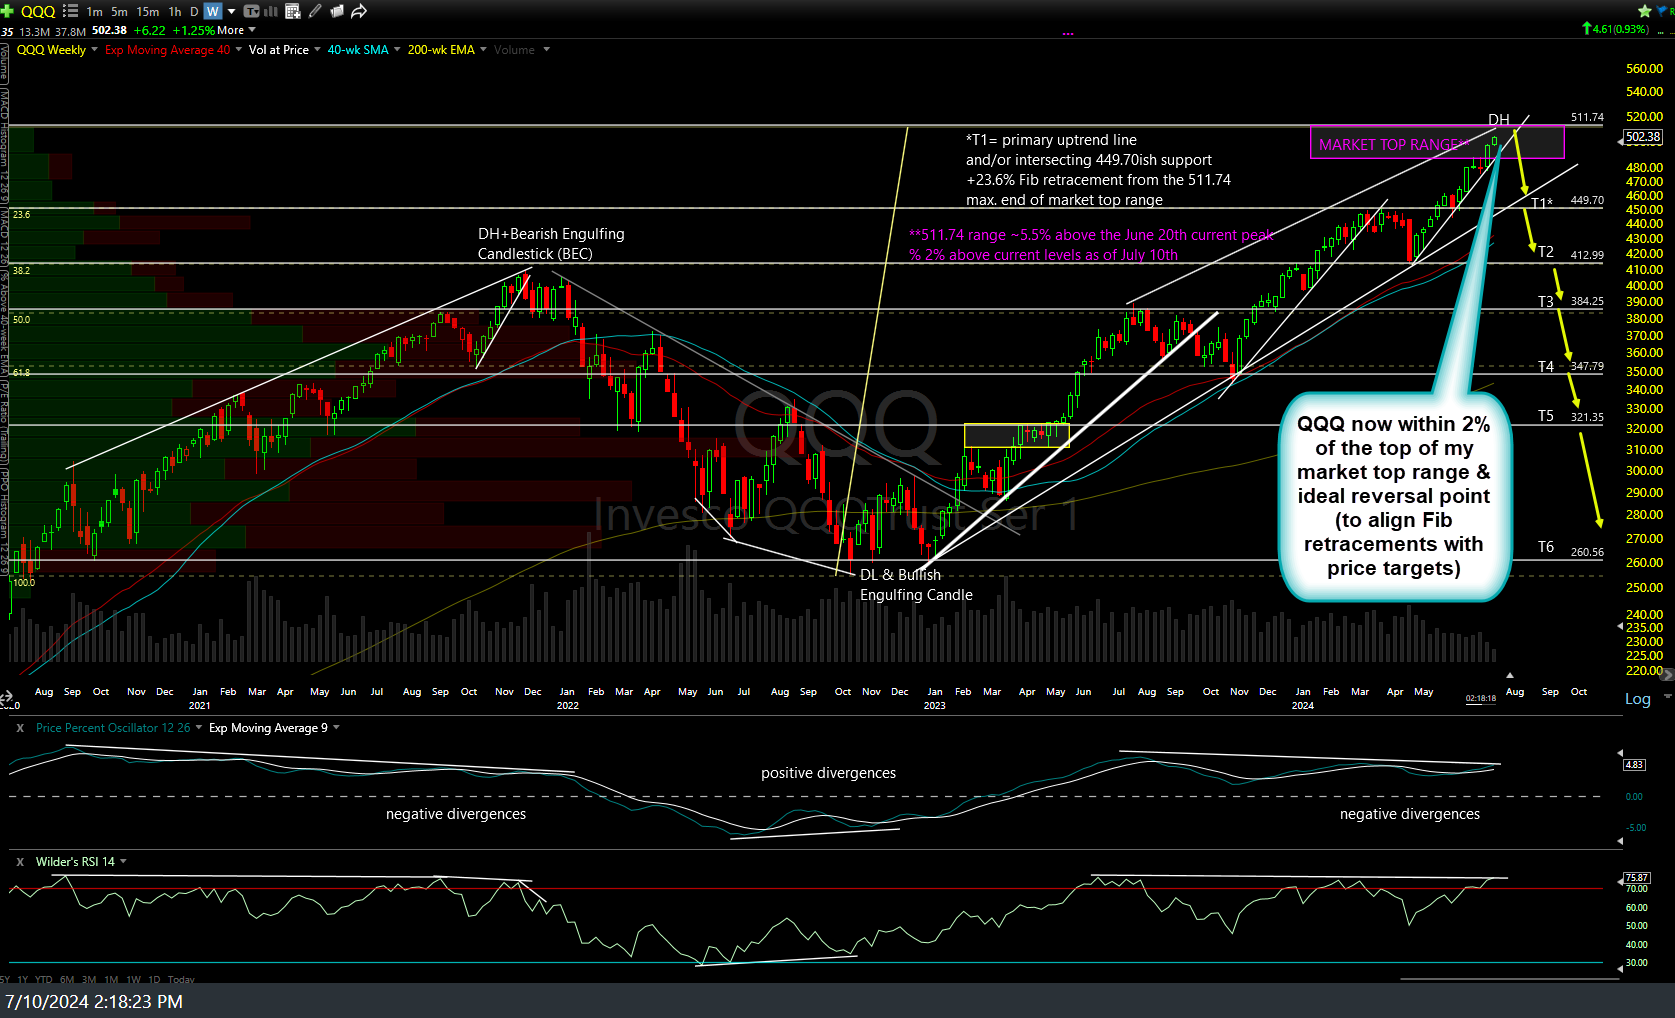
QQQ weeky July 10th
That June 26th chart along with the updated weekly chart of QQQ are also included above. With the Nasdsaq 100 now within 2% of that ideal topping level, QQQ (or /NQ) still offers an objective short entry here & up to but not above 212 with stops commensurate with one’s preferred swing target(s). An alternative initial entry or objective add-on to a starter swing/trend position taken in this range would be on a solid break and/or weekly close below the primary uptrend line off the Jan 2023 lows and interesting T1 support level (449.70).