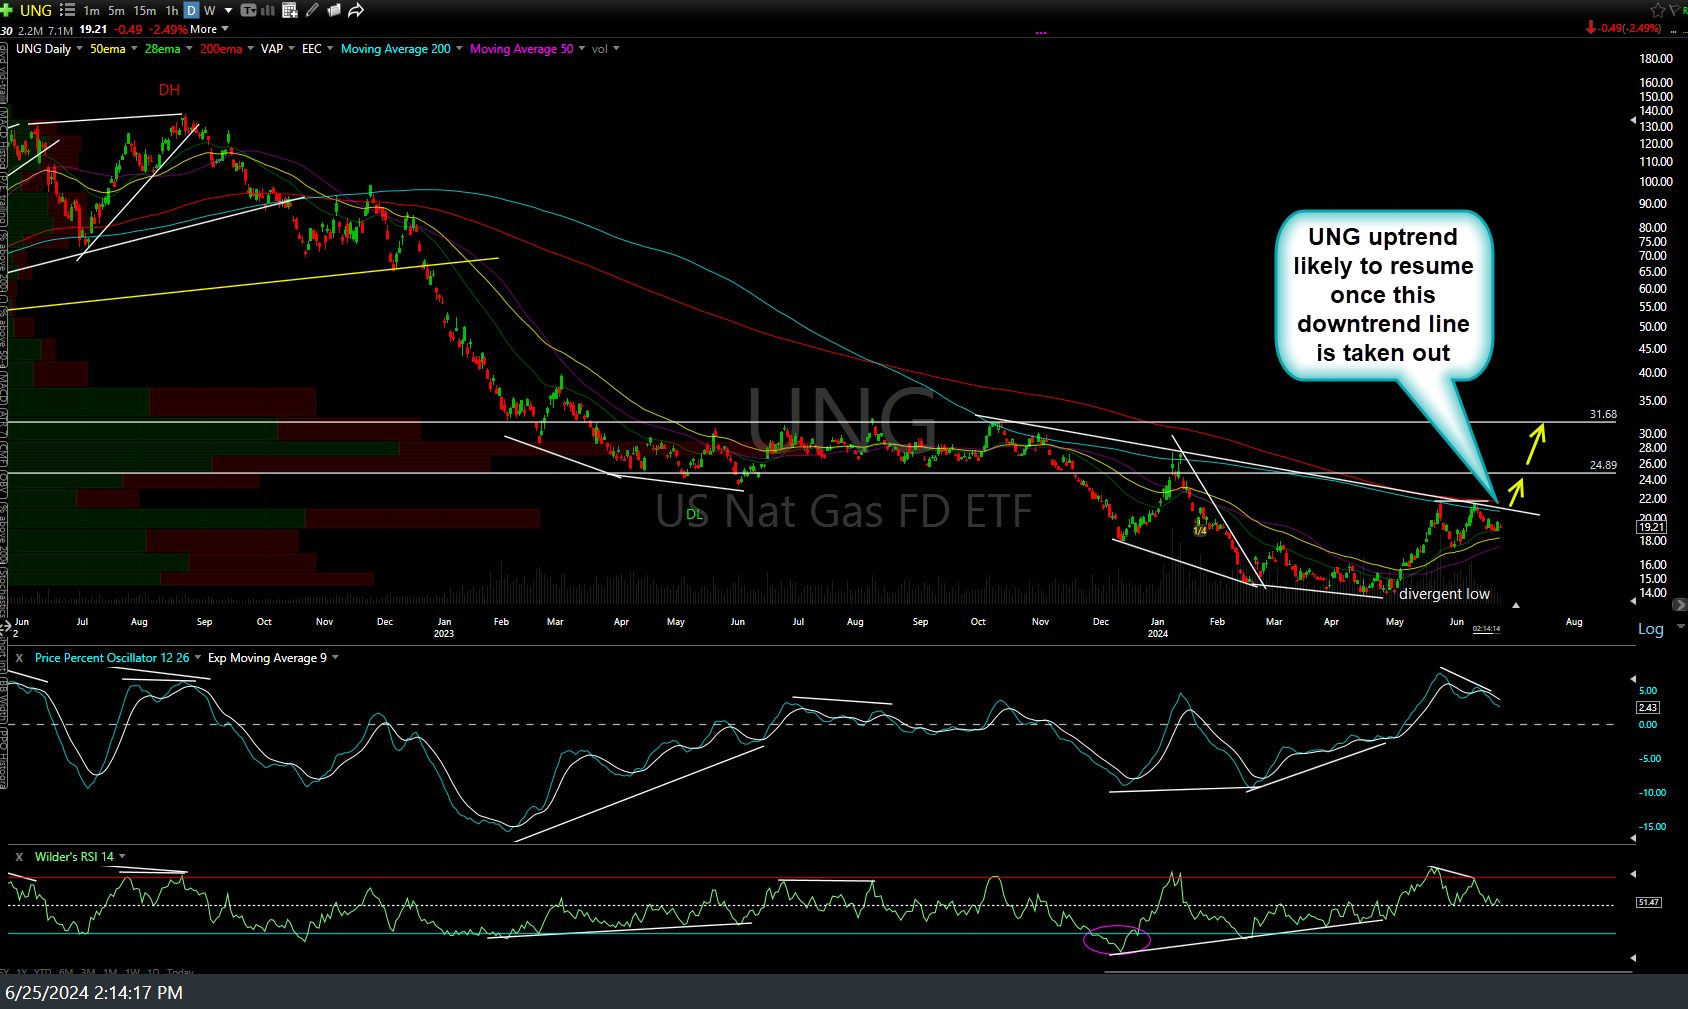
I had intended to cover natural gas in the video posted earlier today but skipped over it. While my near-term convictions on the direction of nat gas aren’t very high at this time, based on the bullish developments on the longer-term daily & weekly charts that I highlighted a few weeks back, I still favor more upside in the coming months. Starting with the daily chart of UNG, it would appear that the current uptrend since the April divergent low is likely to resume when & if this downtrend line is taken out.
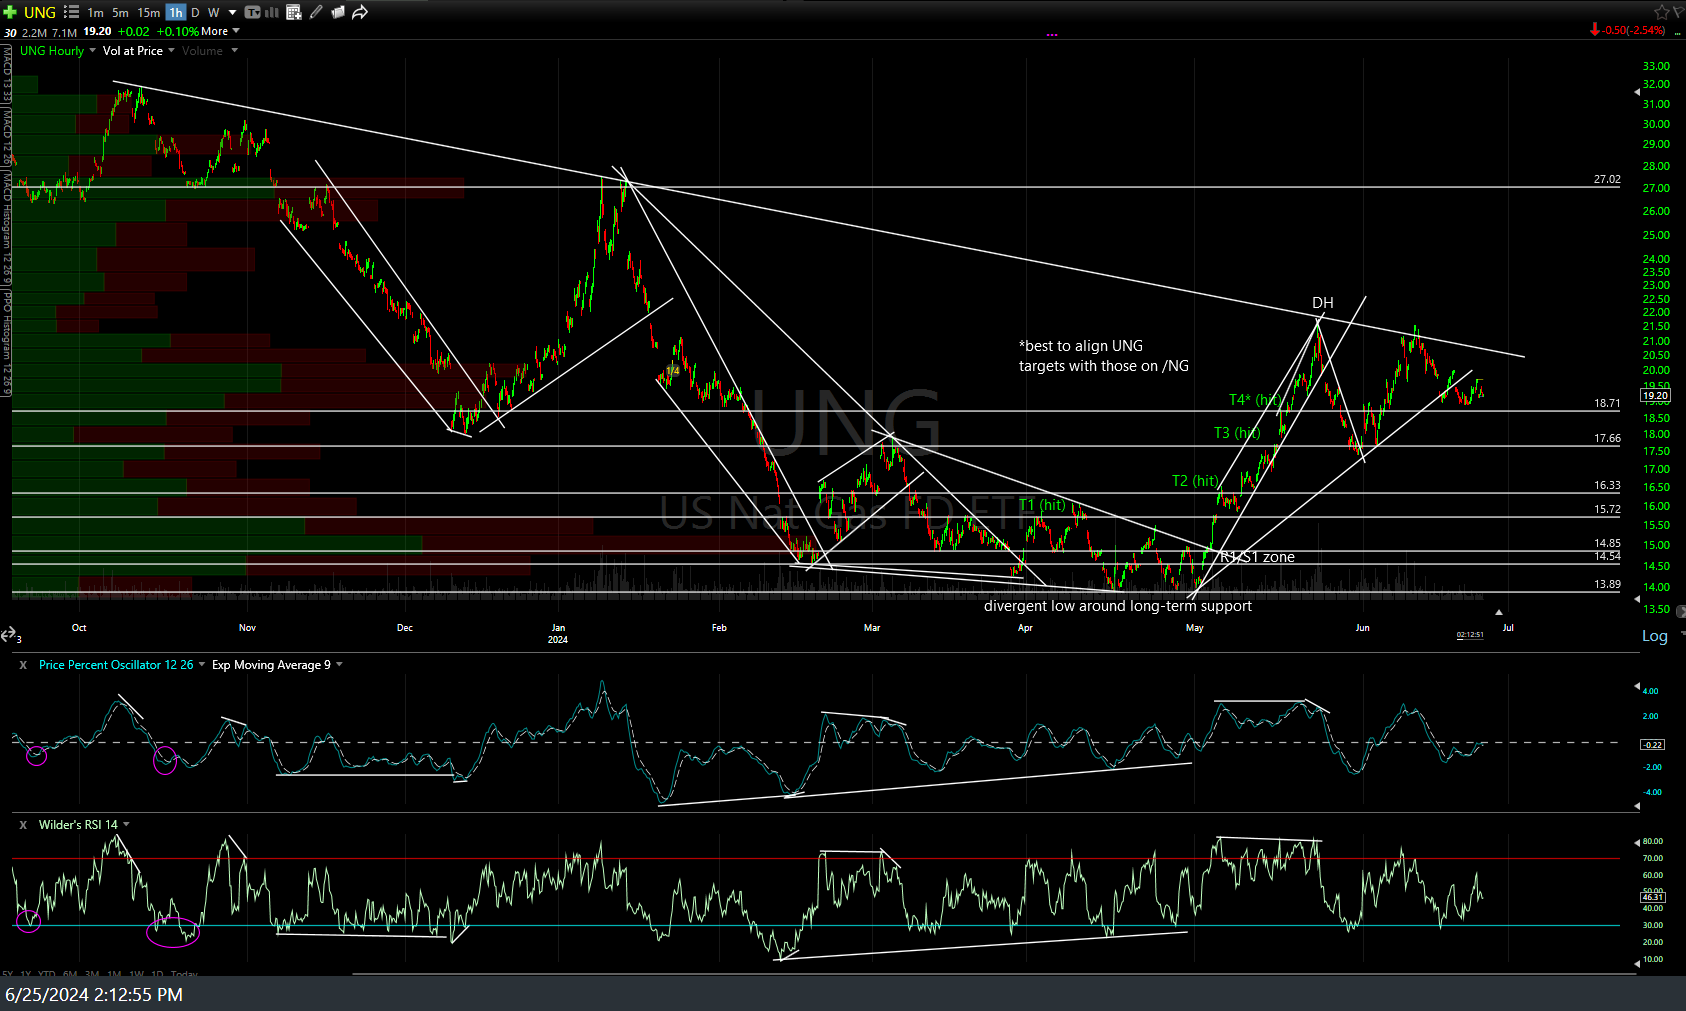
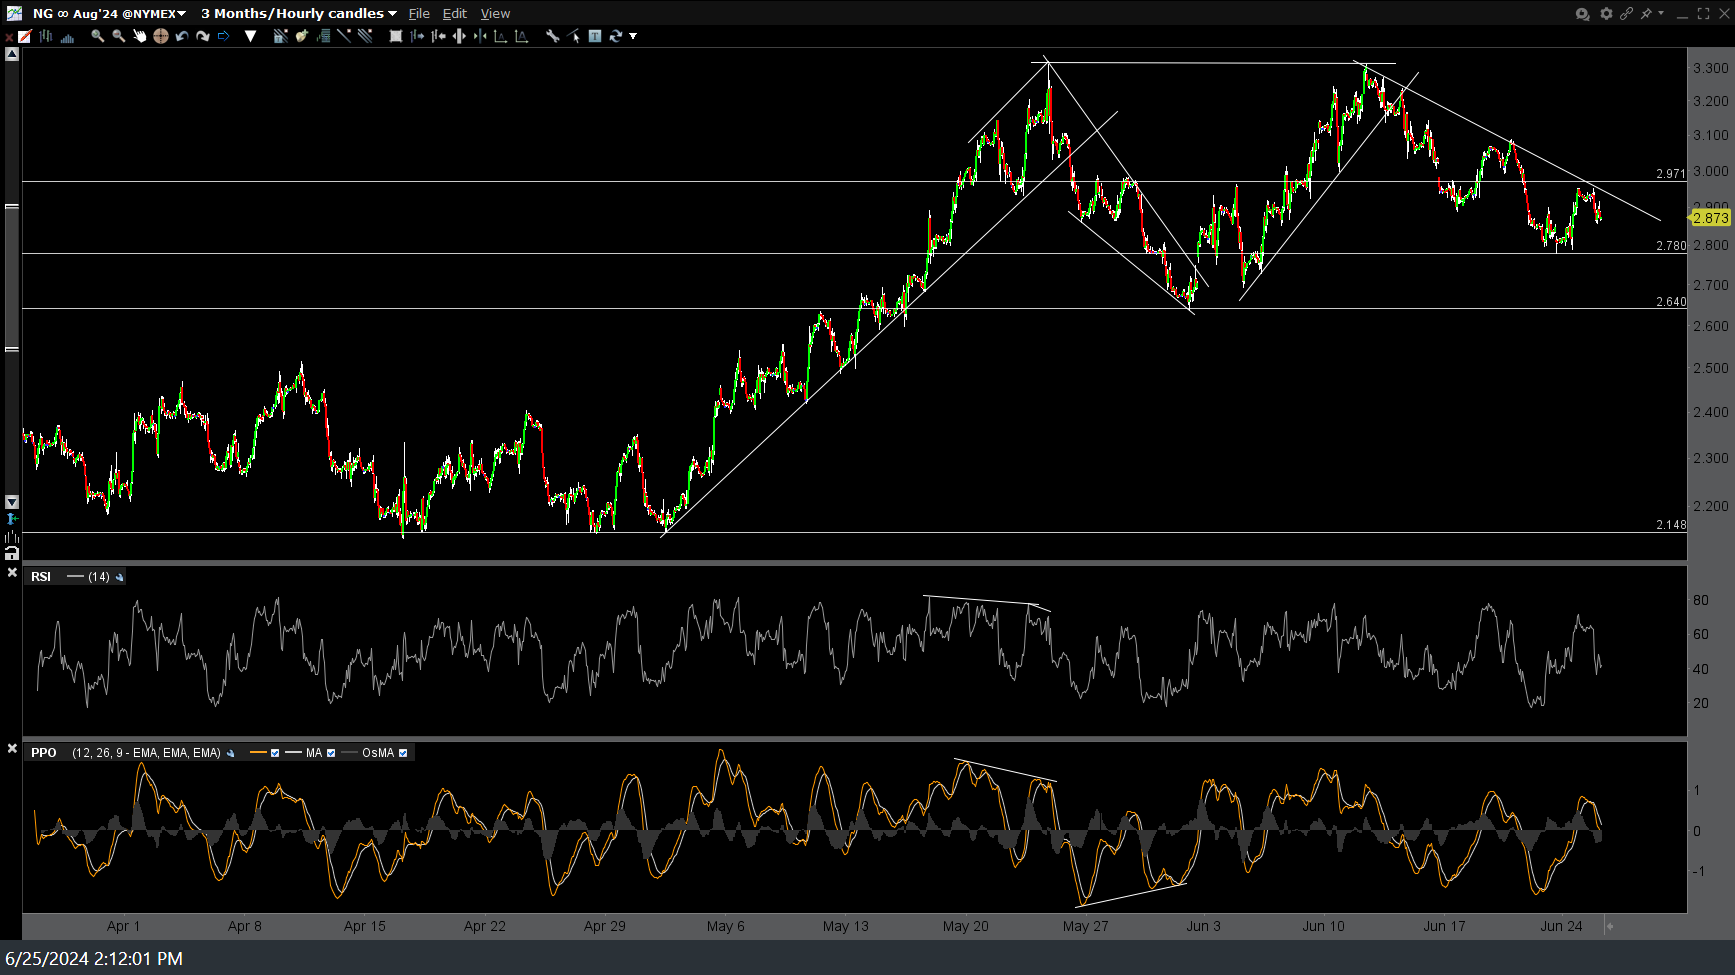
60-minute charts of UNG & /NG (nat gas futures) with support & resistance levels for reference below.


