
Pardon the crude annotations on the charts below as I am working remotely without the usual screen-draw software on my primary (desktop) computer.
Regarding the /NQ (Nasdaq 100 futures) active trade idea posted on Friday, /NQ drifted mostly sideways over the holiday weekend & into today, extending the existing divergences, forming a larger rising wedge pattern on the intraday time frames, with that wedge breaking down earlier today (first 5-minute chart below), going on to hit both the first (18877) & second (18839) price targets, reversing off that second target & is current backtesting the 18929 resistance from below, thereby offering another objective short entry for those targeting T3 (18802/next target) or more.
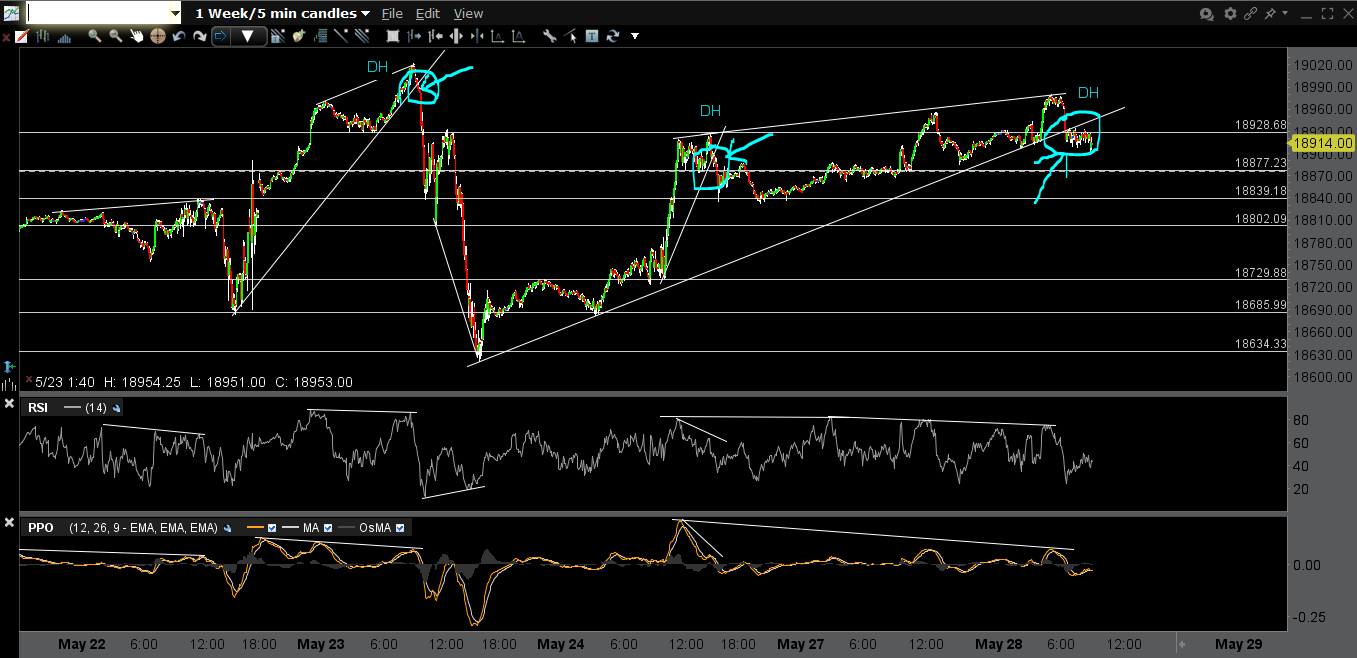
NQ 5m May 28th

NQ 5m 2 May 28th
For typical swing & trend traders, this bounce back to resistance on the very short-term intraday charts also provides an objective short entry or add-on for a longer-term swing trade as both QQQ & SPY remain below their highs from Thursday when they put in bearish engulfing candlesticks (potential reversal sticks) with stops somewhat above.
/GC (gold futures) is currently backtesting the upper-most of the two parallel trendlines after the recent breakdown. As such gold (and/or GDX) also offers an objective shorte entry or add-on as long as it remains below this trendline. 120-minute chart below.
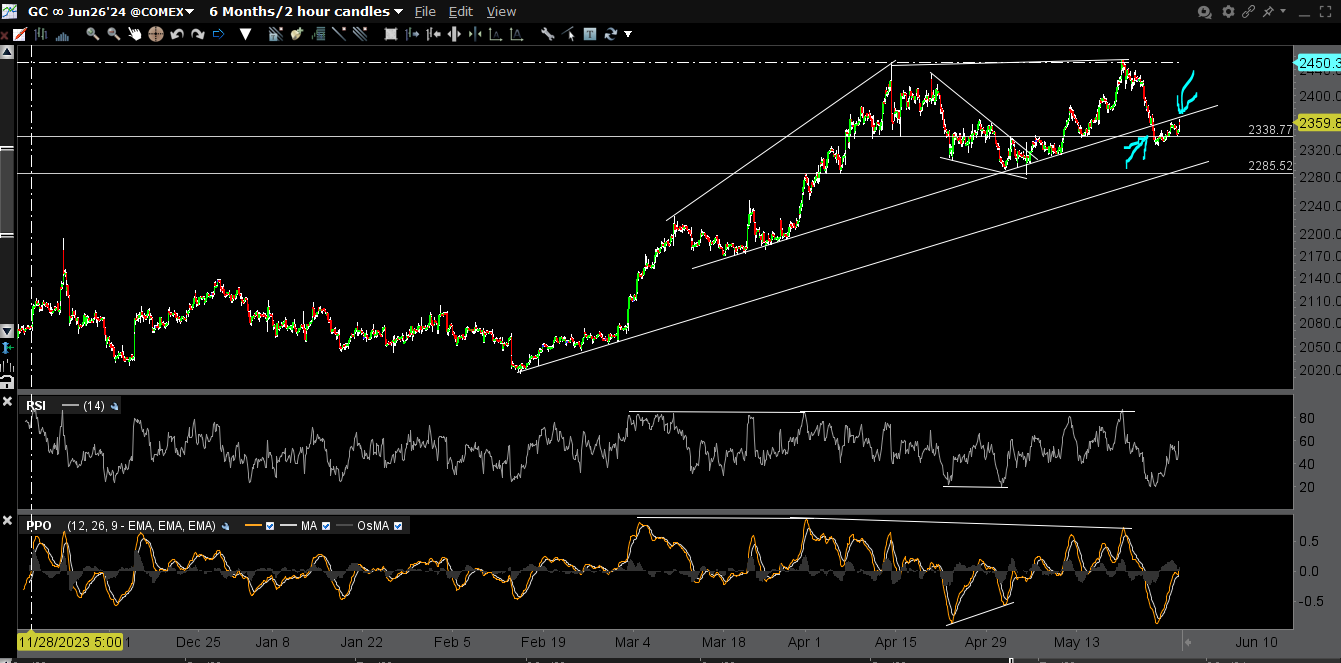
GC 120m May 28
On an admin note, I hope to be able to return home later today or tomorrow by the latest but will post any significant developments that I come across before if & when I can.