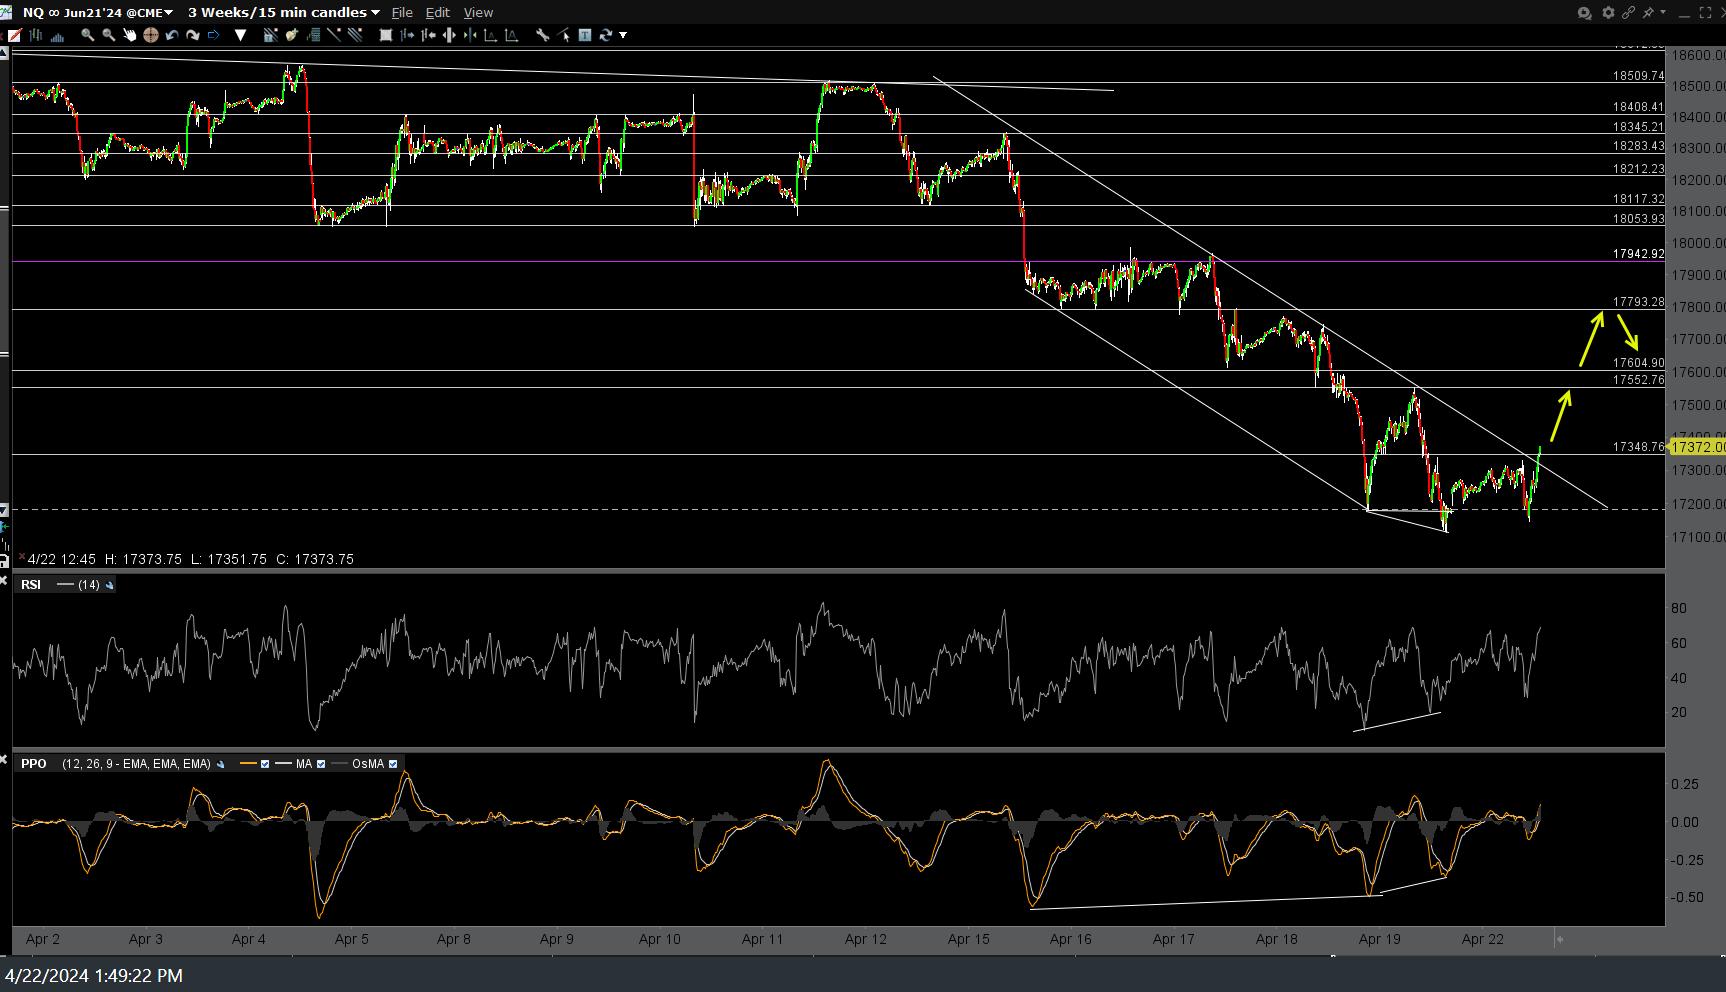
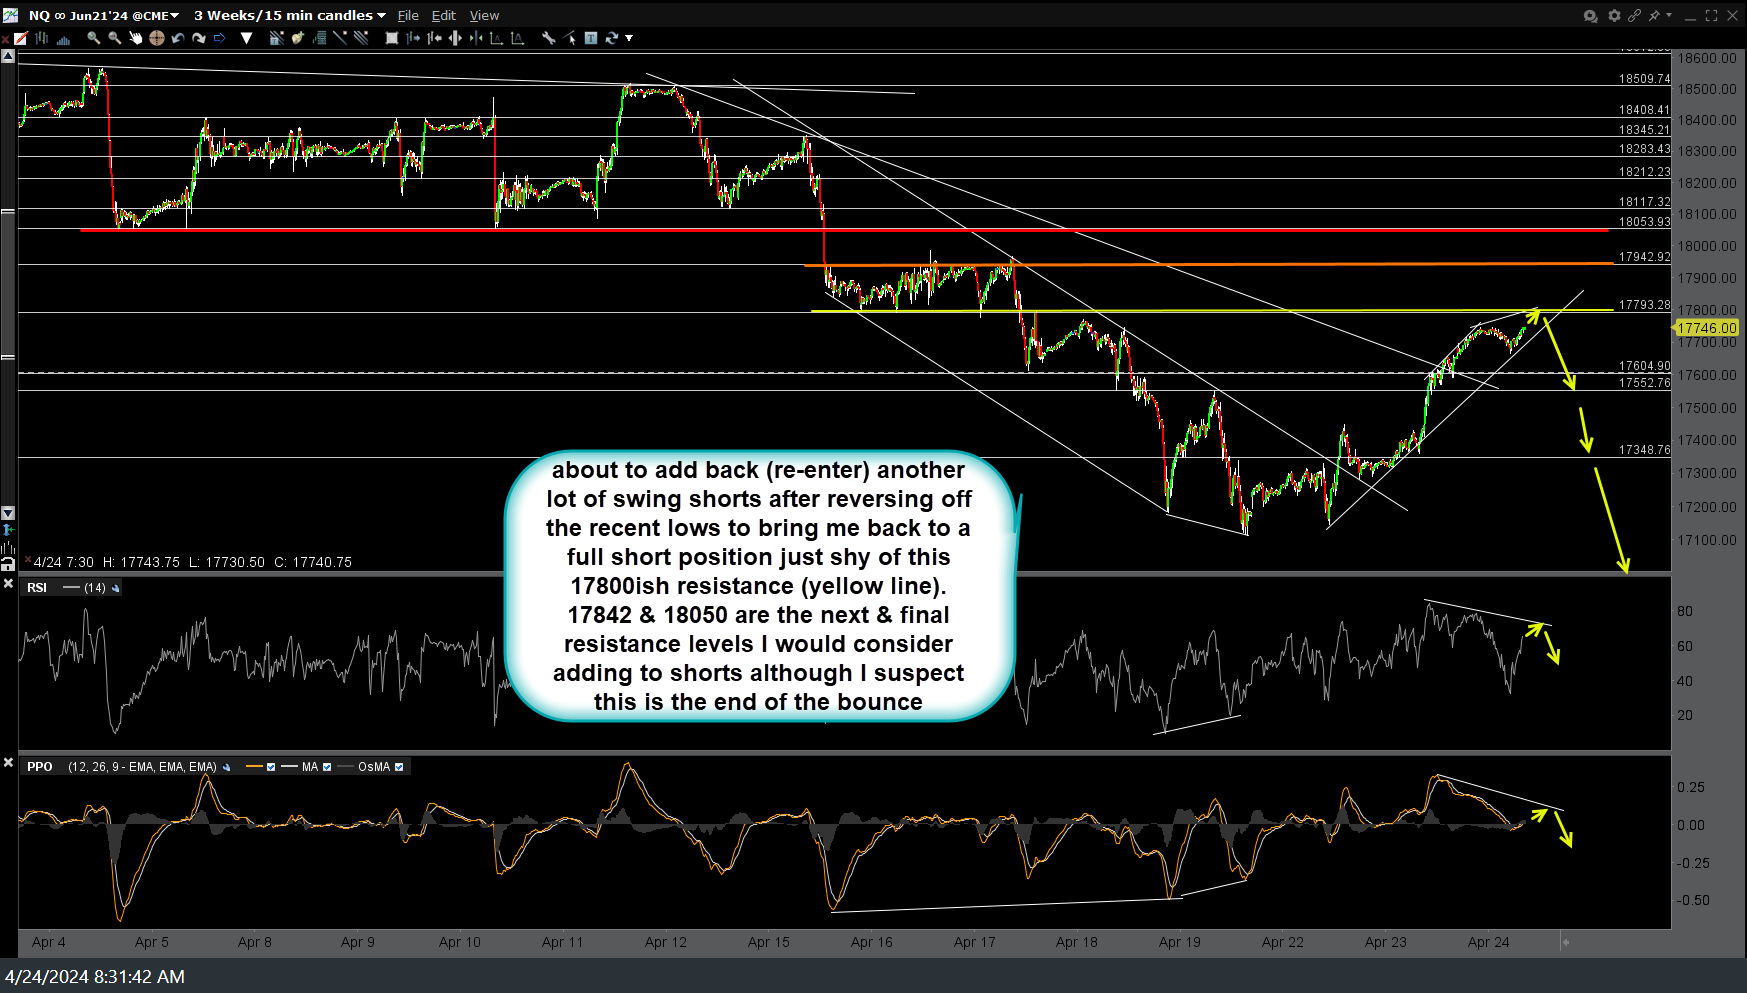
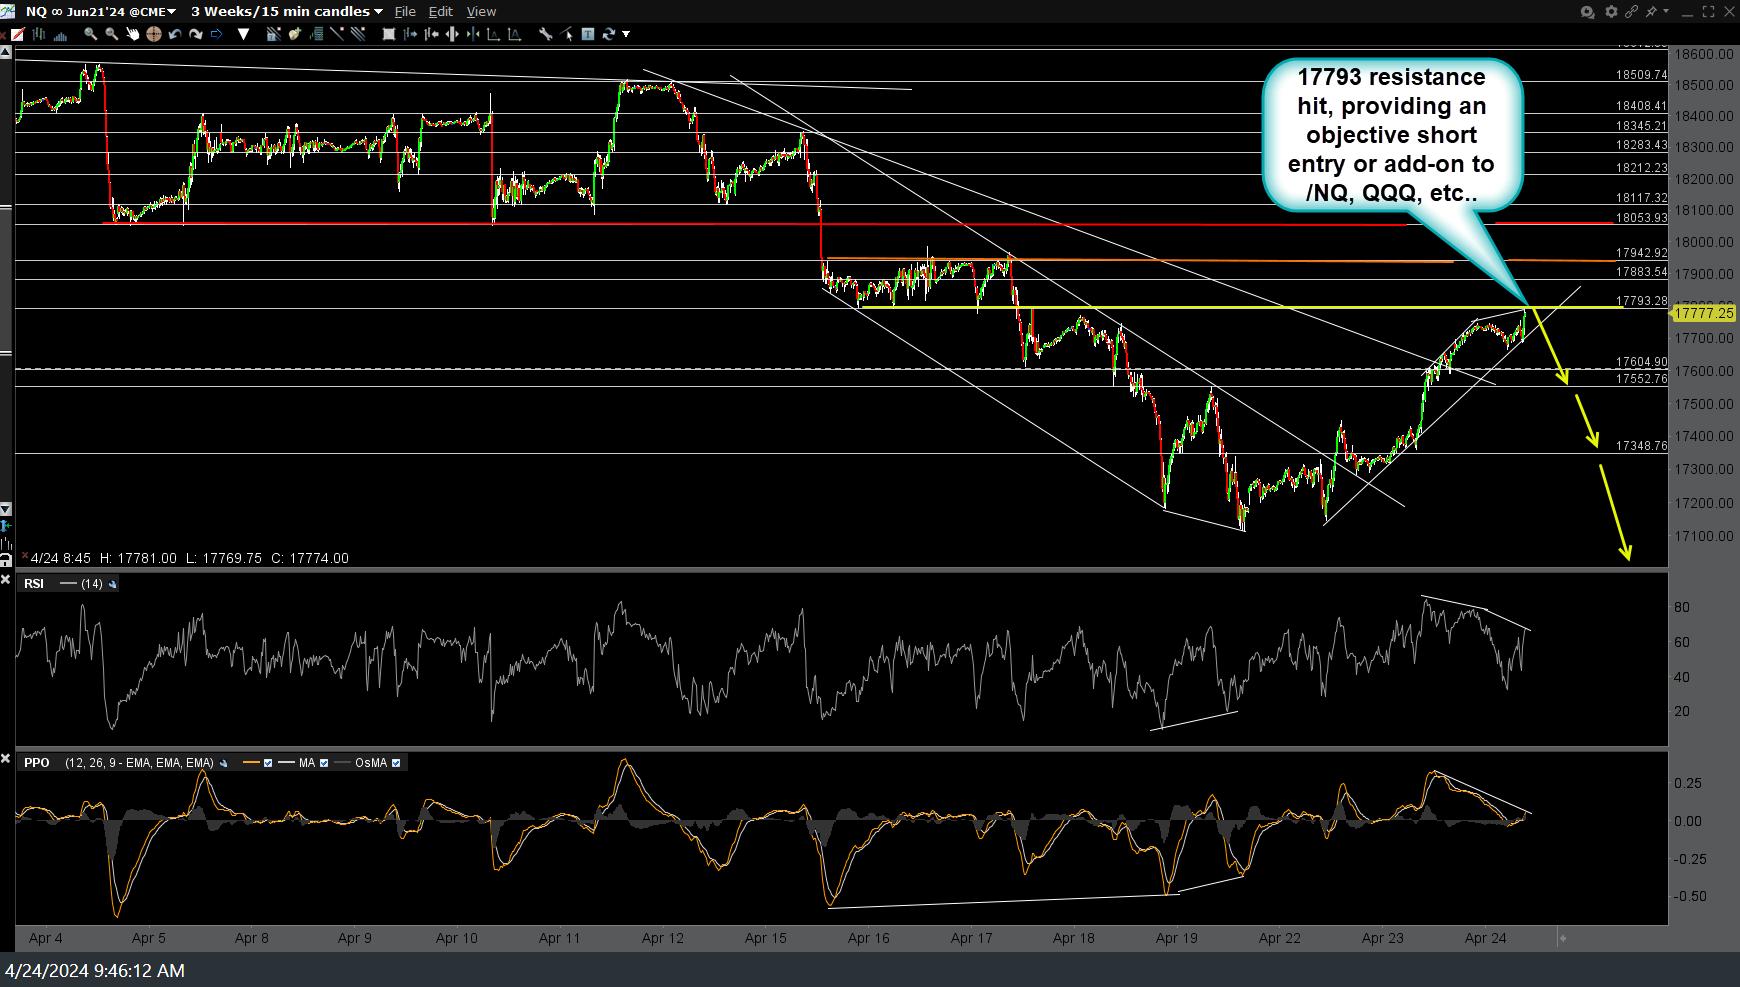
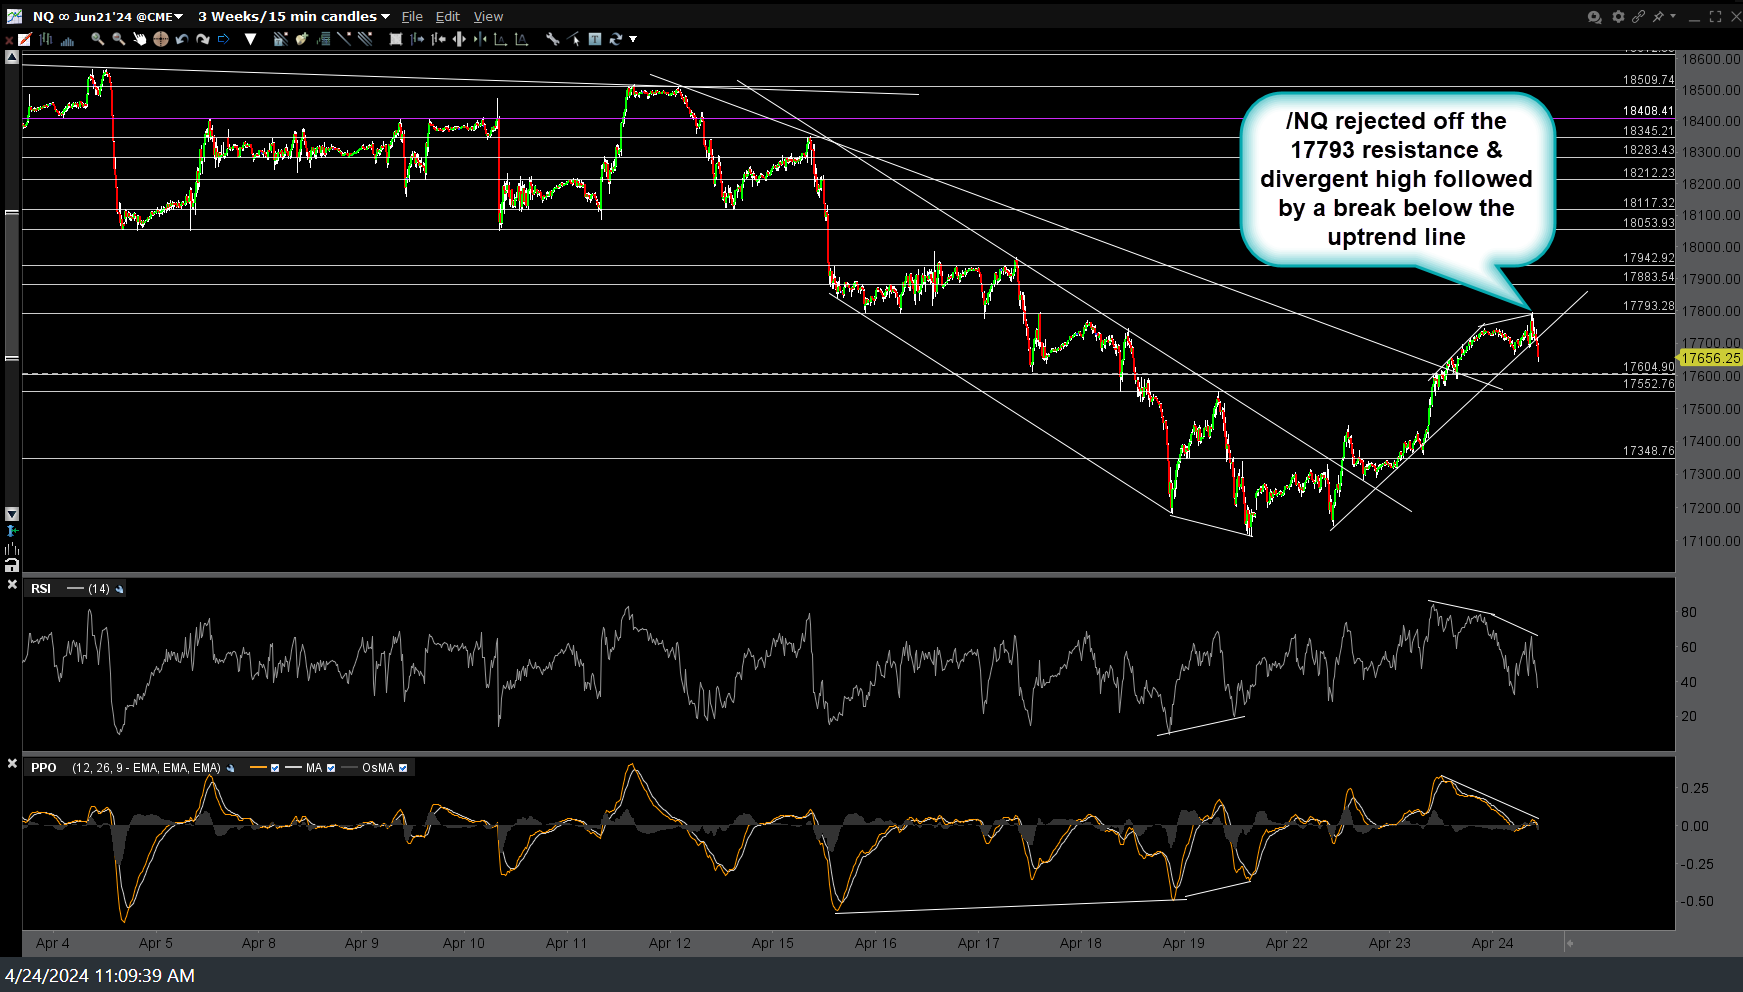
As expected, /NQ (Nasdaq 100 futures) was rejected off the rally into the 17793 resistance + divergent high followed by a break below the uptrend line. Previous (Monday’s & the two charts from earlier today) & updated 15-minute charts below. Can’t get much more precise than that.
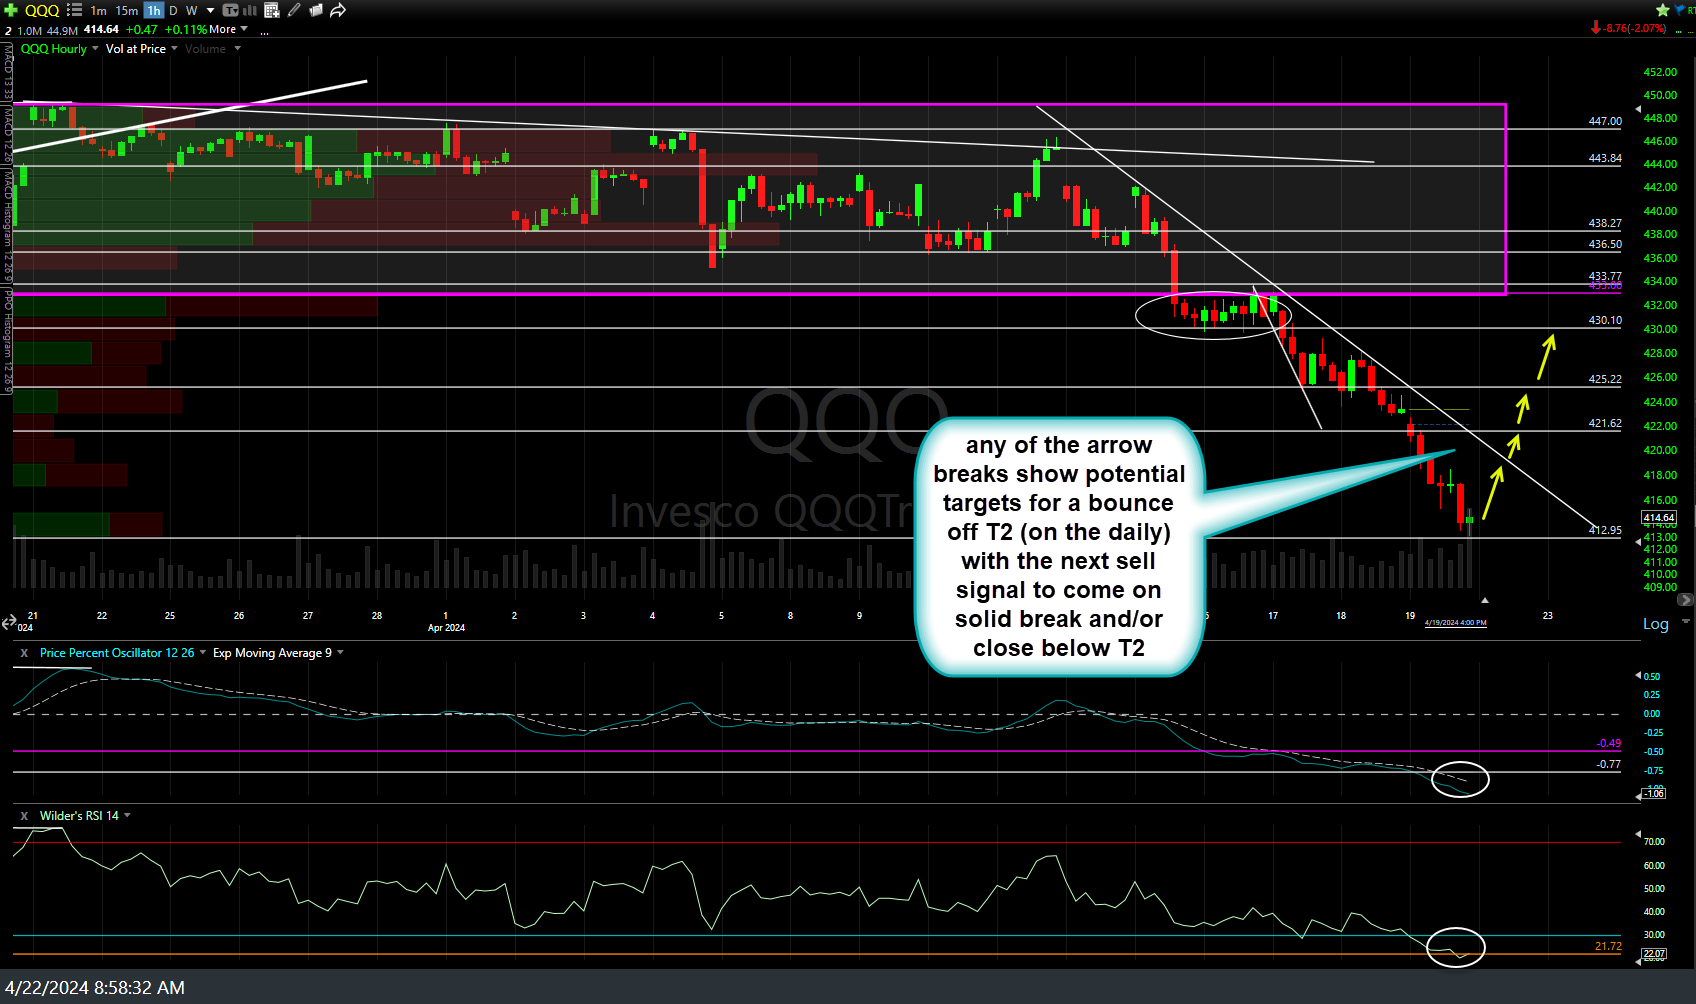
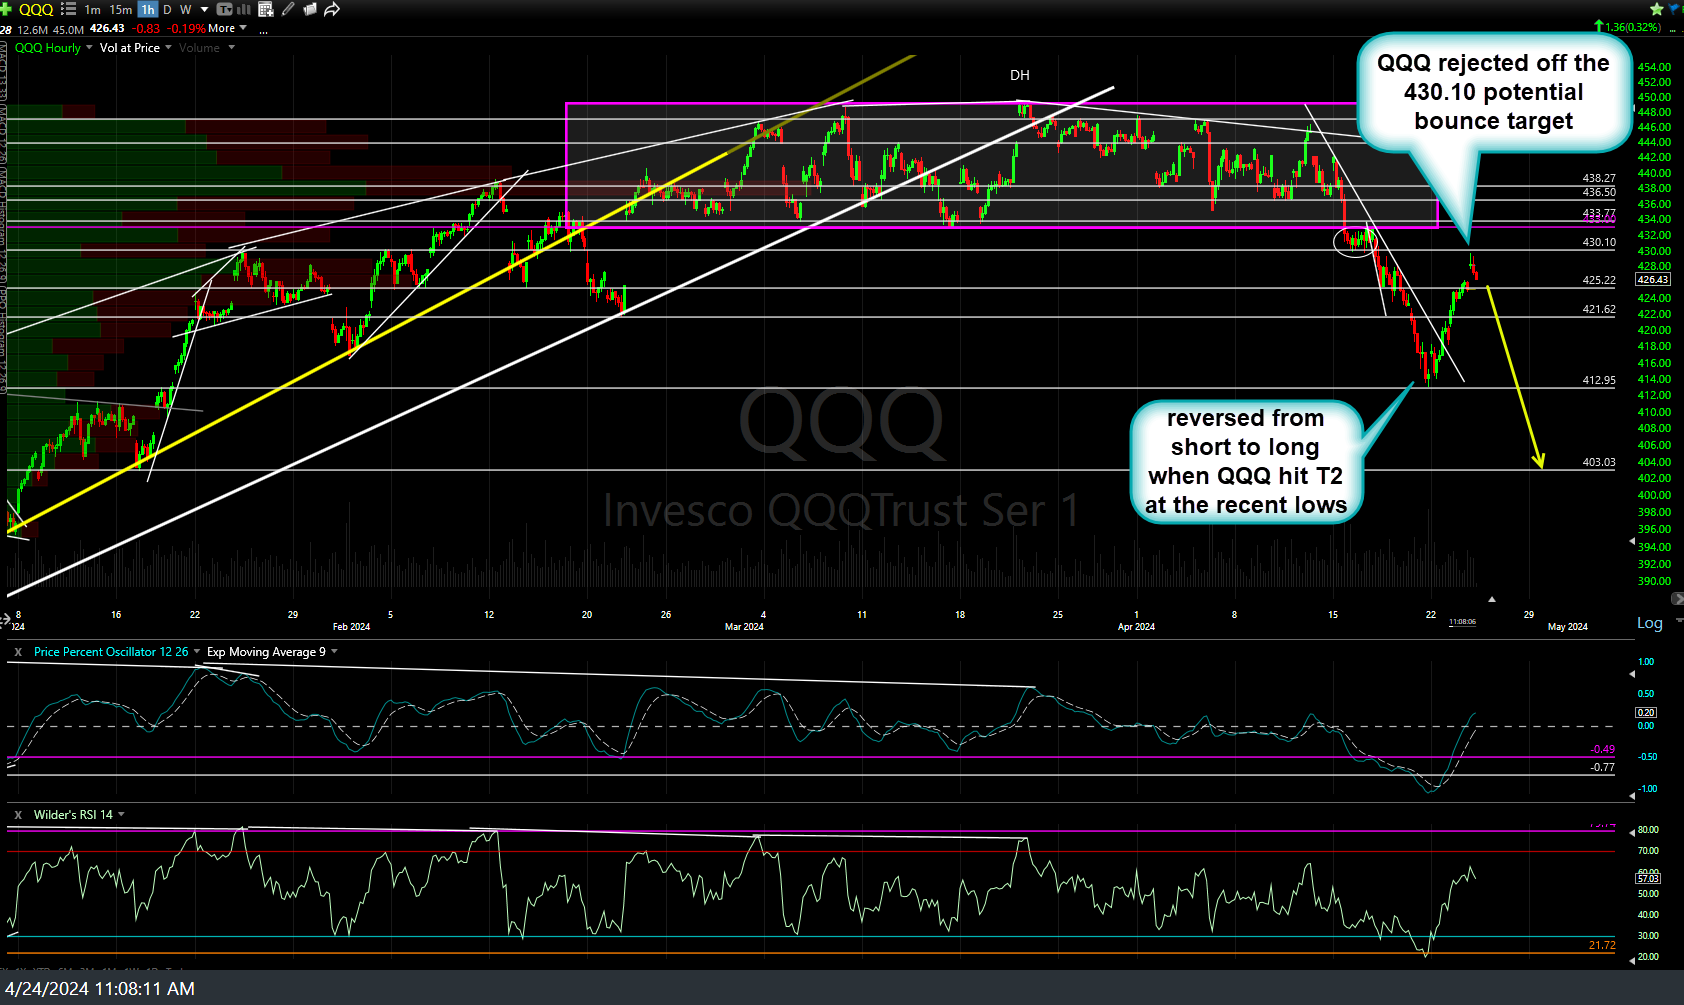
For ETF traders, QQQ also hit & was rejected off the 430.10 bounce target that was posted off the lows on Monday, giving flexible swing traders the ability cover the post-FOMC QQQ short for an 8% gain, reverse to long & either side-step up to a 4% giveback in gains and/or enhance that swing position by up to another 4% for a 12% profit so far (not including the 1% drop off the rejection at those /NQ & QQQ bounce targets). Monday’s & today’s updated 60-minute charts below.
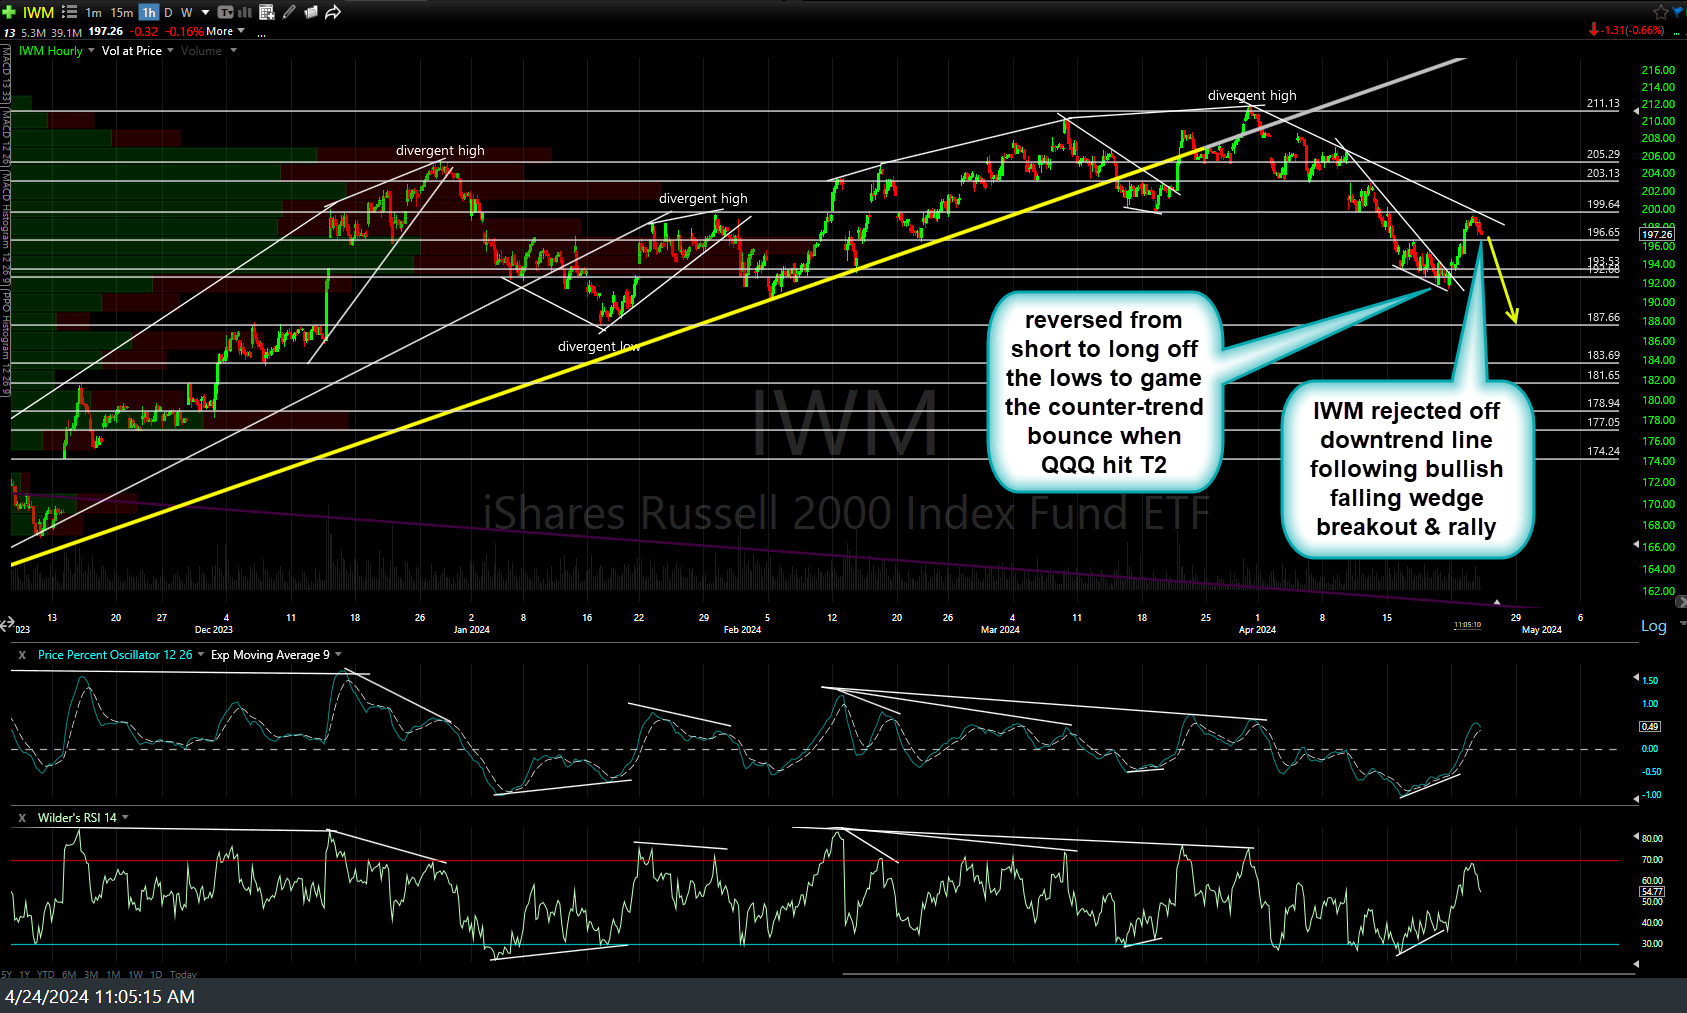
Likewise, the other primary index highlighted as a swing short recently, IWM (Russell 2000 Small-cap ETF), was just rejected off downtrend line following bullish falling wedge breakout & rally & has also quite likely run the full course of the counter-trend bounce with the next leg down now just getting underway. 60-minute chart below.


