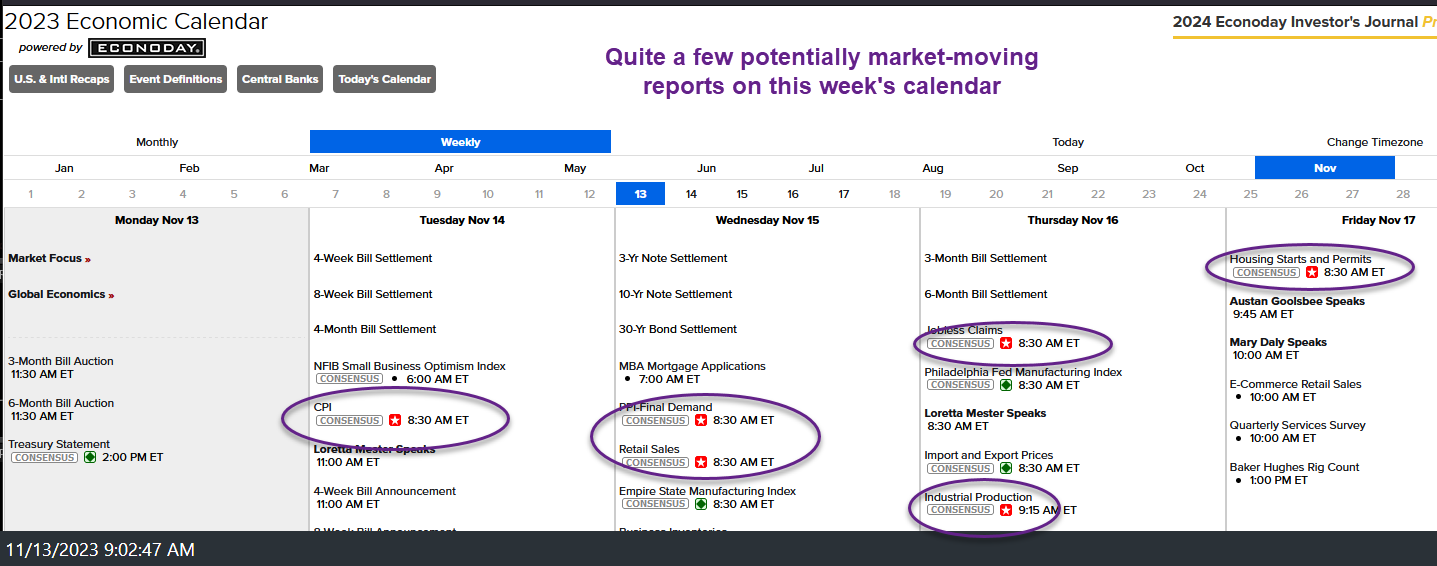
There are quite a few potentially market-moving reports on this week’s calendar, circled below.
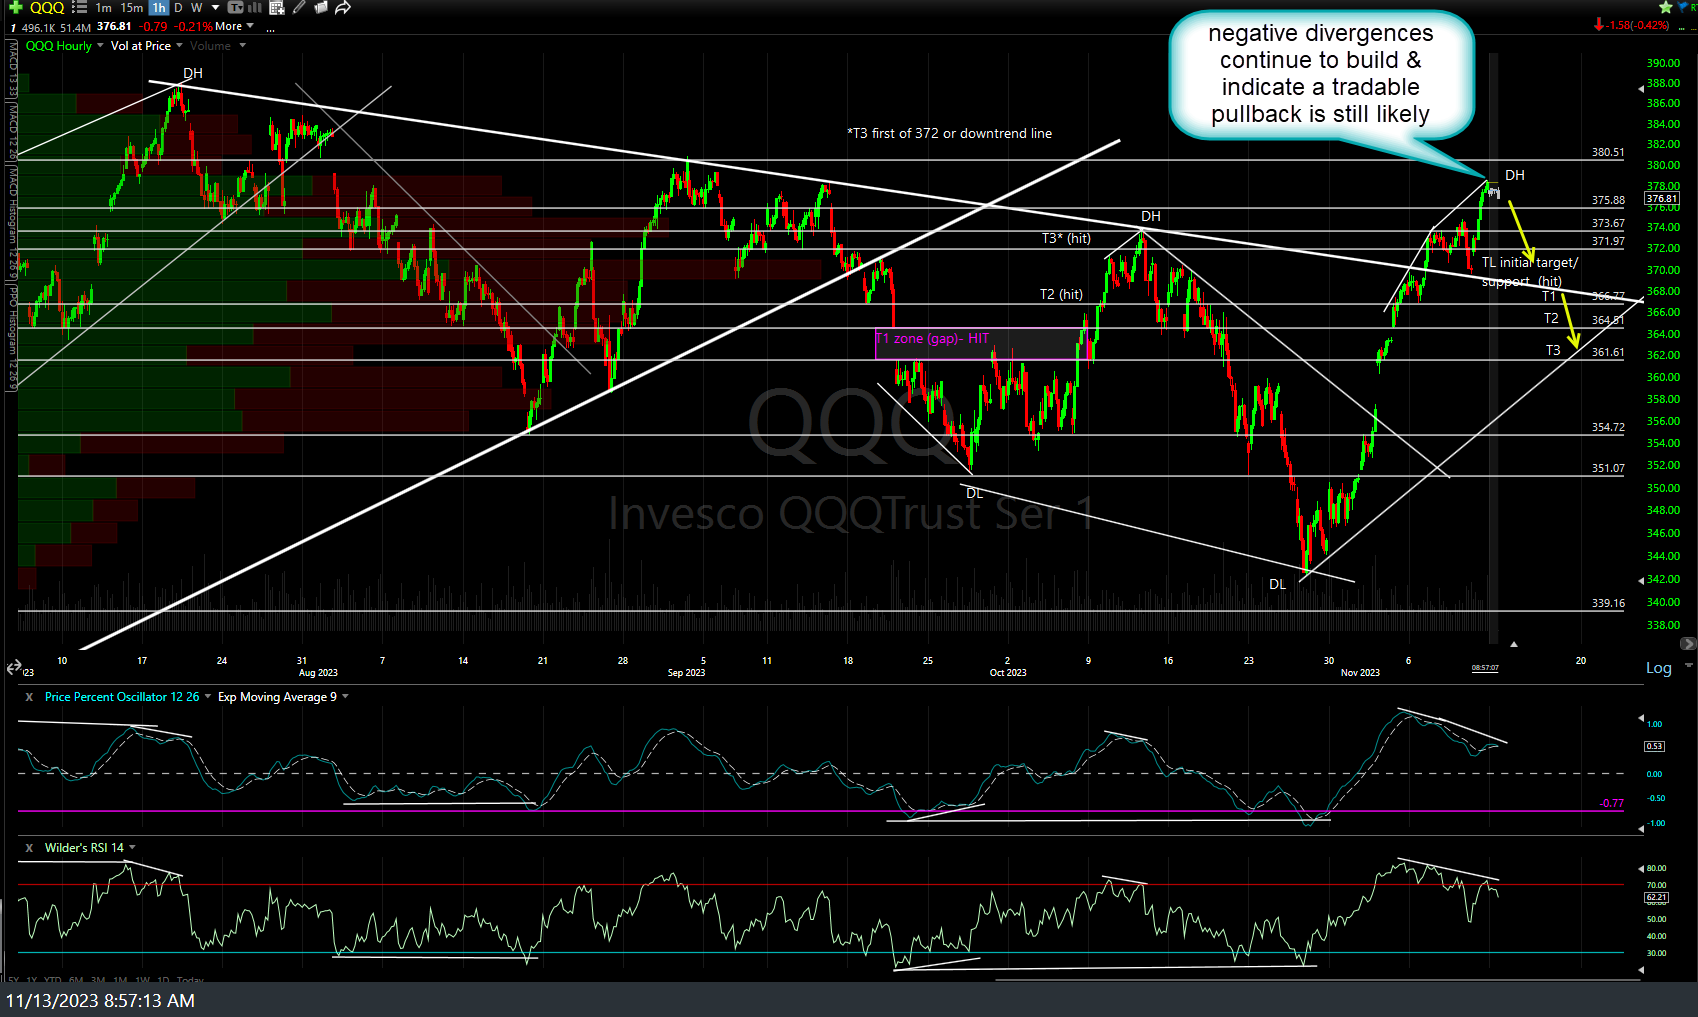
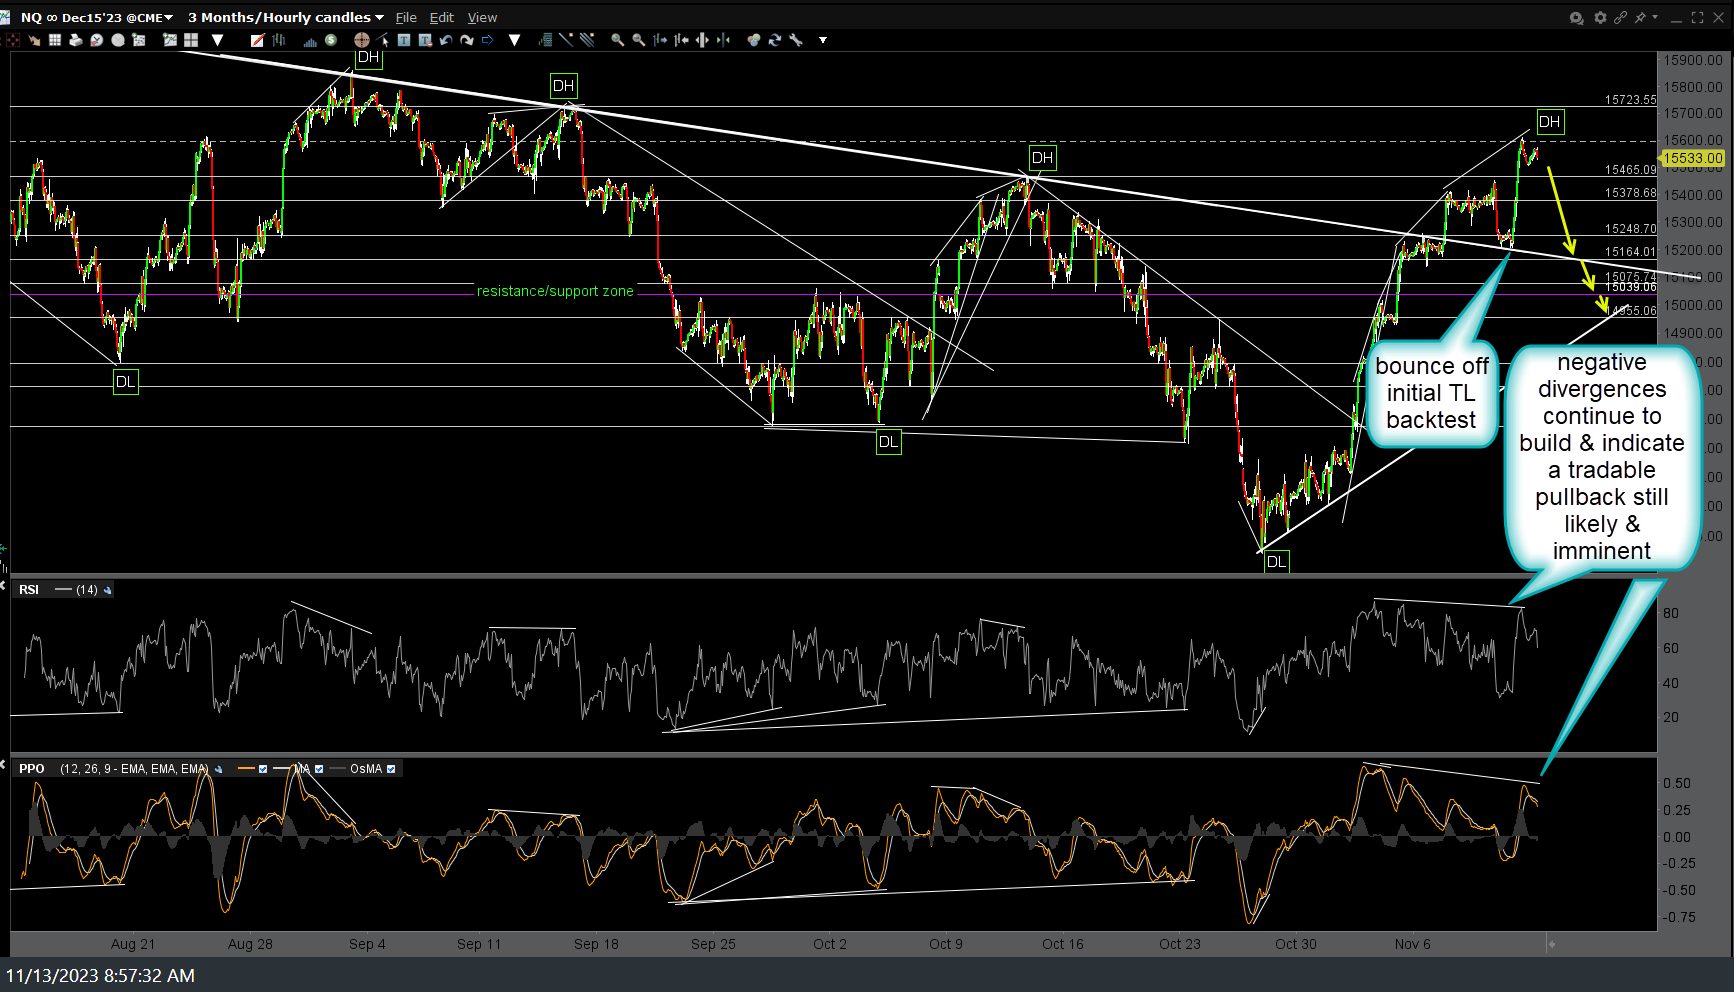
Following the initial test & reaction (bounce) off the 60-minute downtrend line (1st pullback target) on Friday, the negative divergences on both /NQ (Nasdaq 100 futures) and QQQ ($NDX etf) continue to build, still indicating that a tradable pullback is likely & imminent at this time. 60-minute charts below.
Bottom line: While some technical damage was inflicted in the intermediate to longer-term bearish case when Friday’s rally took out the previous (Oct 12th) reaction high & also taking out the 61.8% Fib retracement level, thereby calling the downtrend off the mid-July highs into question, the current technical posture of the stock indices, including but not limited to the fact that ALL of the most diversified major stock indices (S&P 500, Wilshire 5000, VTI, plus the equal-weighted Nasdaq 100) all remain below their primary downtrend lines from the mid-July highs, a decent case that the downtrend line remains intact for now with this being a counter-trend rally into resistance (for the majority of stocks).
Of course, solid breakouts and daily or especially weekly closes above the primary downtrend lines in the majority of diversified indexes would increase the odds of that ‘marginal new highs’ scenario that I’ve yet to rule out. Either way, with the majority of US stock indices current backtesting their mid-July downtrend lines from below coupled with the negative divergences on the $NDX, an objective case to short with the appropriate stops above can certainly be made here.


