
/NQ (Nasdaq 100) made another reversal off the 15150ish resistance level that was highlighted yesterday morning, further validating that as a significant resistance level, with the negative divergences still intact. While a solid break above that level will still be near-term bullish, resistance is resistance until & unless taken out and breaks below the minor uptrend line & 14941 supports just below would likely usher in more selling. Previous (yesterday’s) & updated 15-minute charts below.
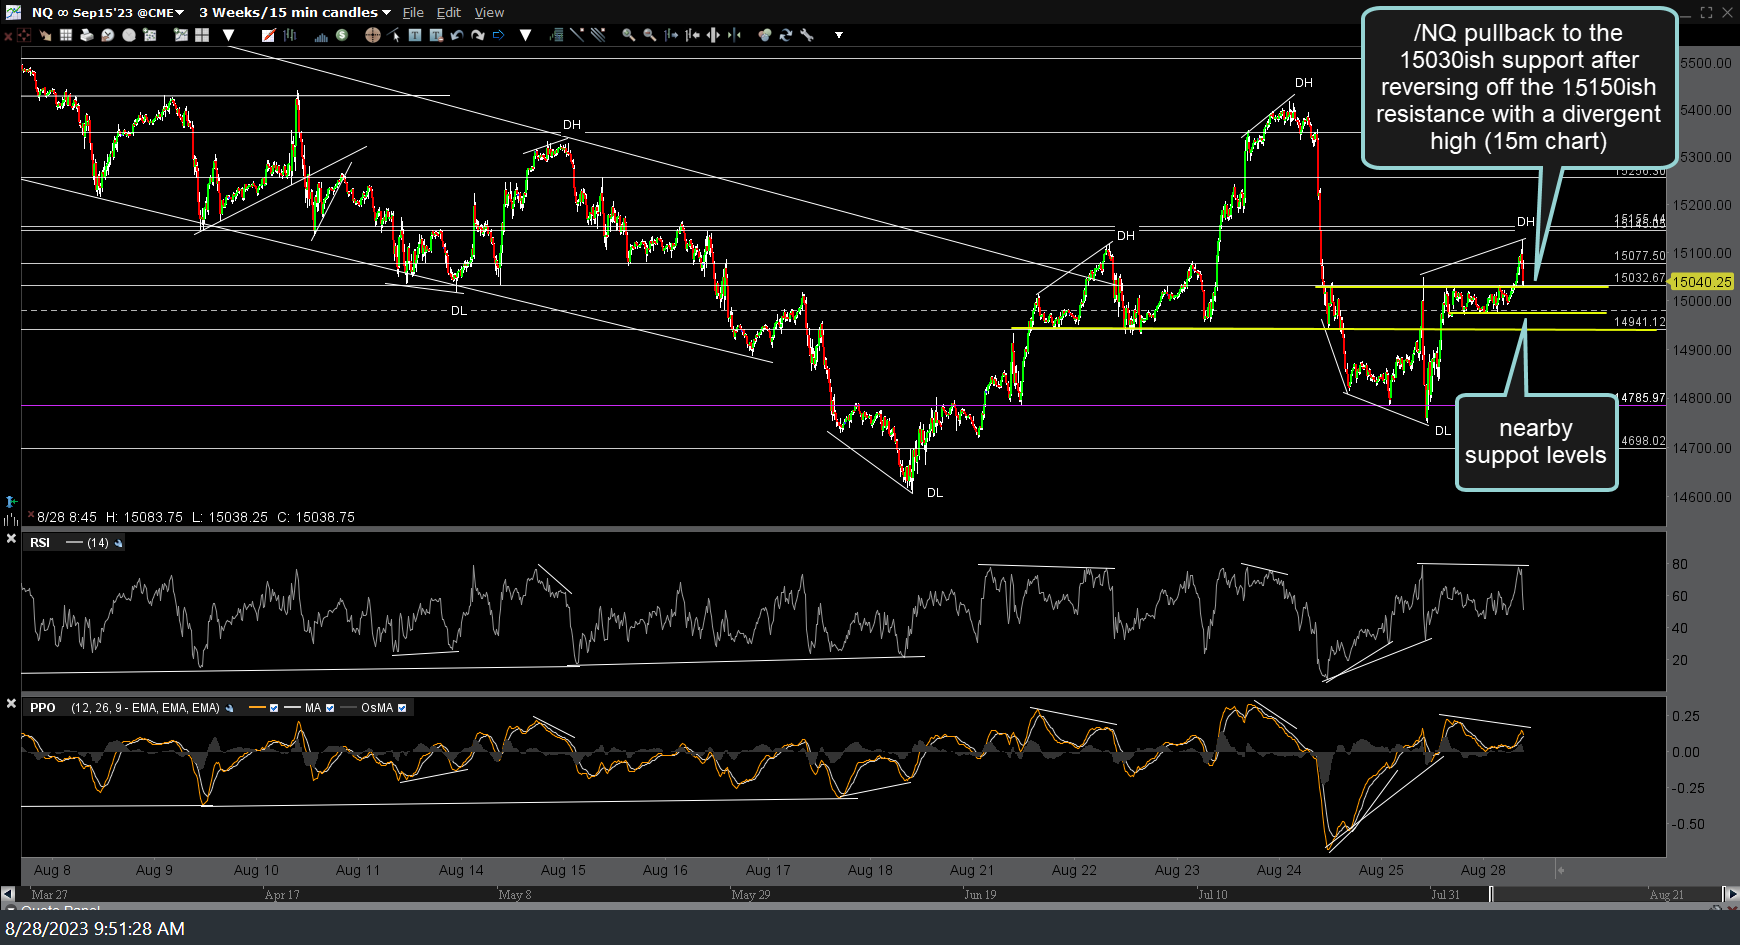
NQ 15m Aug 28th
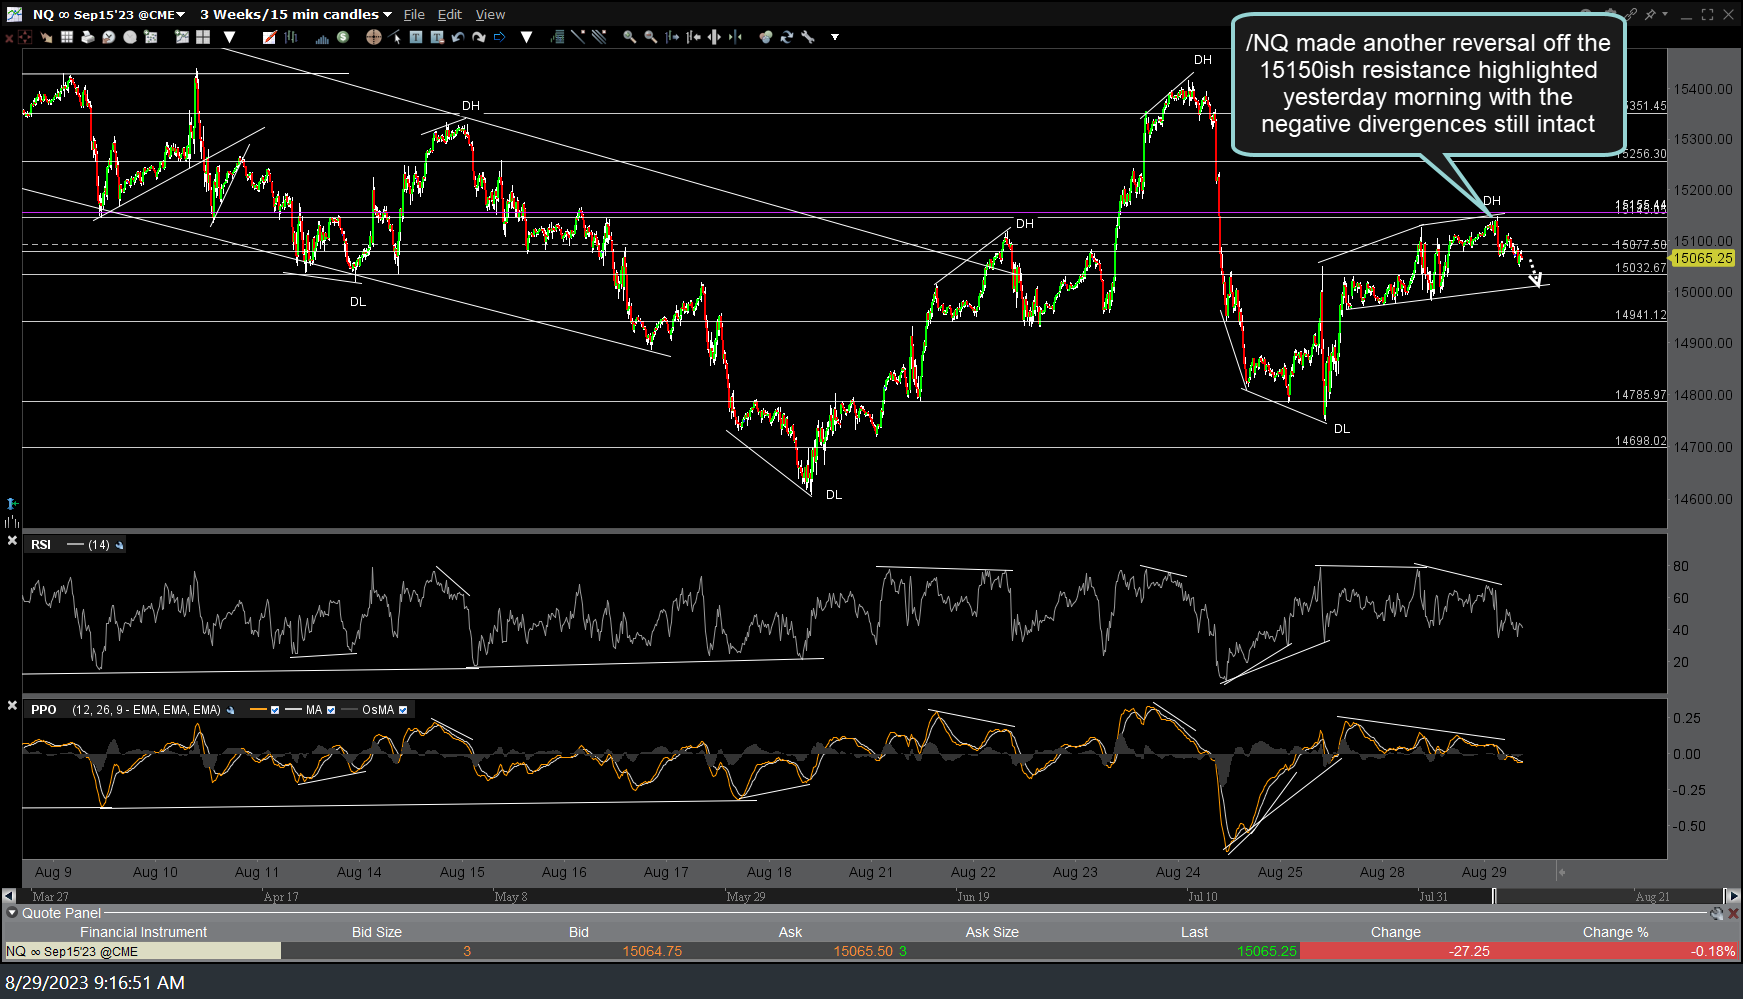
NQ 15m Aug 29th
/RTY (Russell 2000 Small-cap futures) had the reaction that I was favoring (at least 2) off the 60-minute downtrend line/falling wedge pattern. Same story there as well: A solid break above the pattern ALONG with breakouts in the large-caps, would be near-term bullish while resistance remains resistance until & unless broken. While the very near-term outlook is somewhat obscure IMO, as of now, I favor more downside in /RTY & IWM following the recent failures at that trendline resistance. Previous (yesterday am) & updated 60-minute charts below.
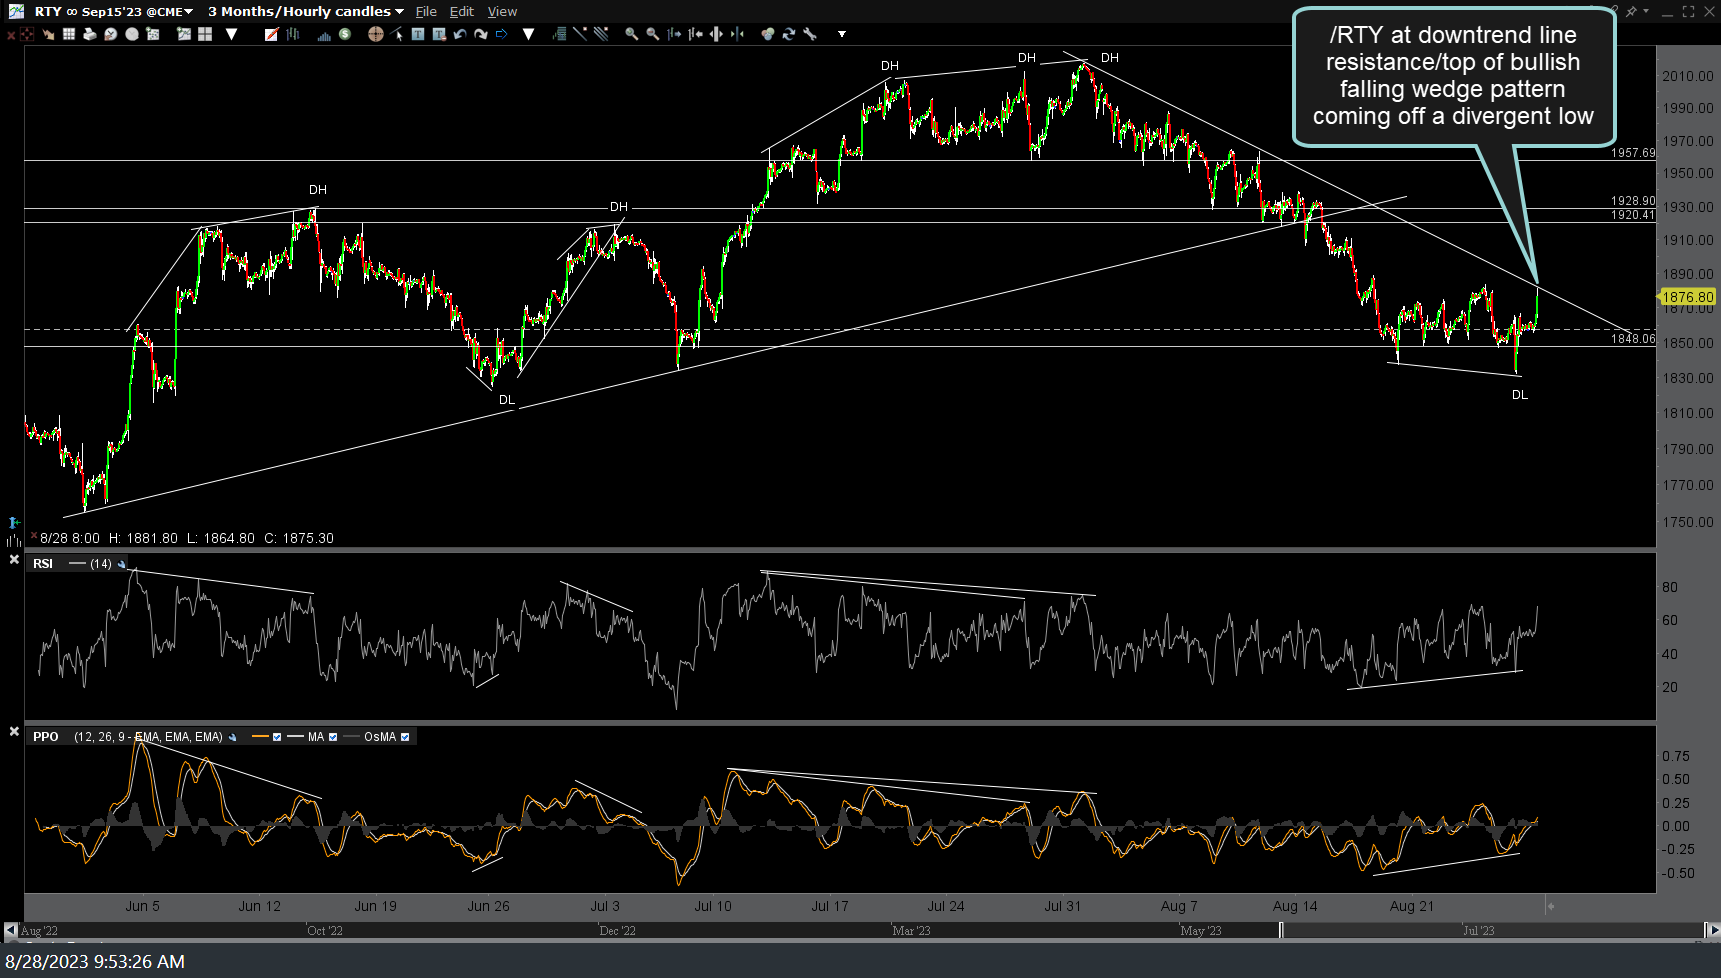
RTY 60m Aug 28th
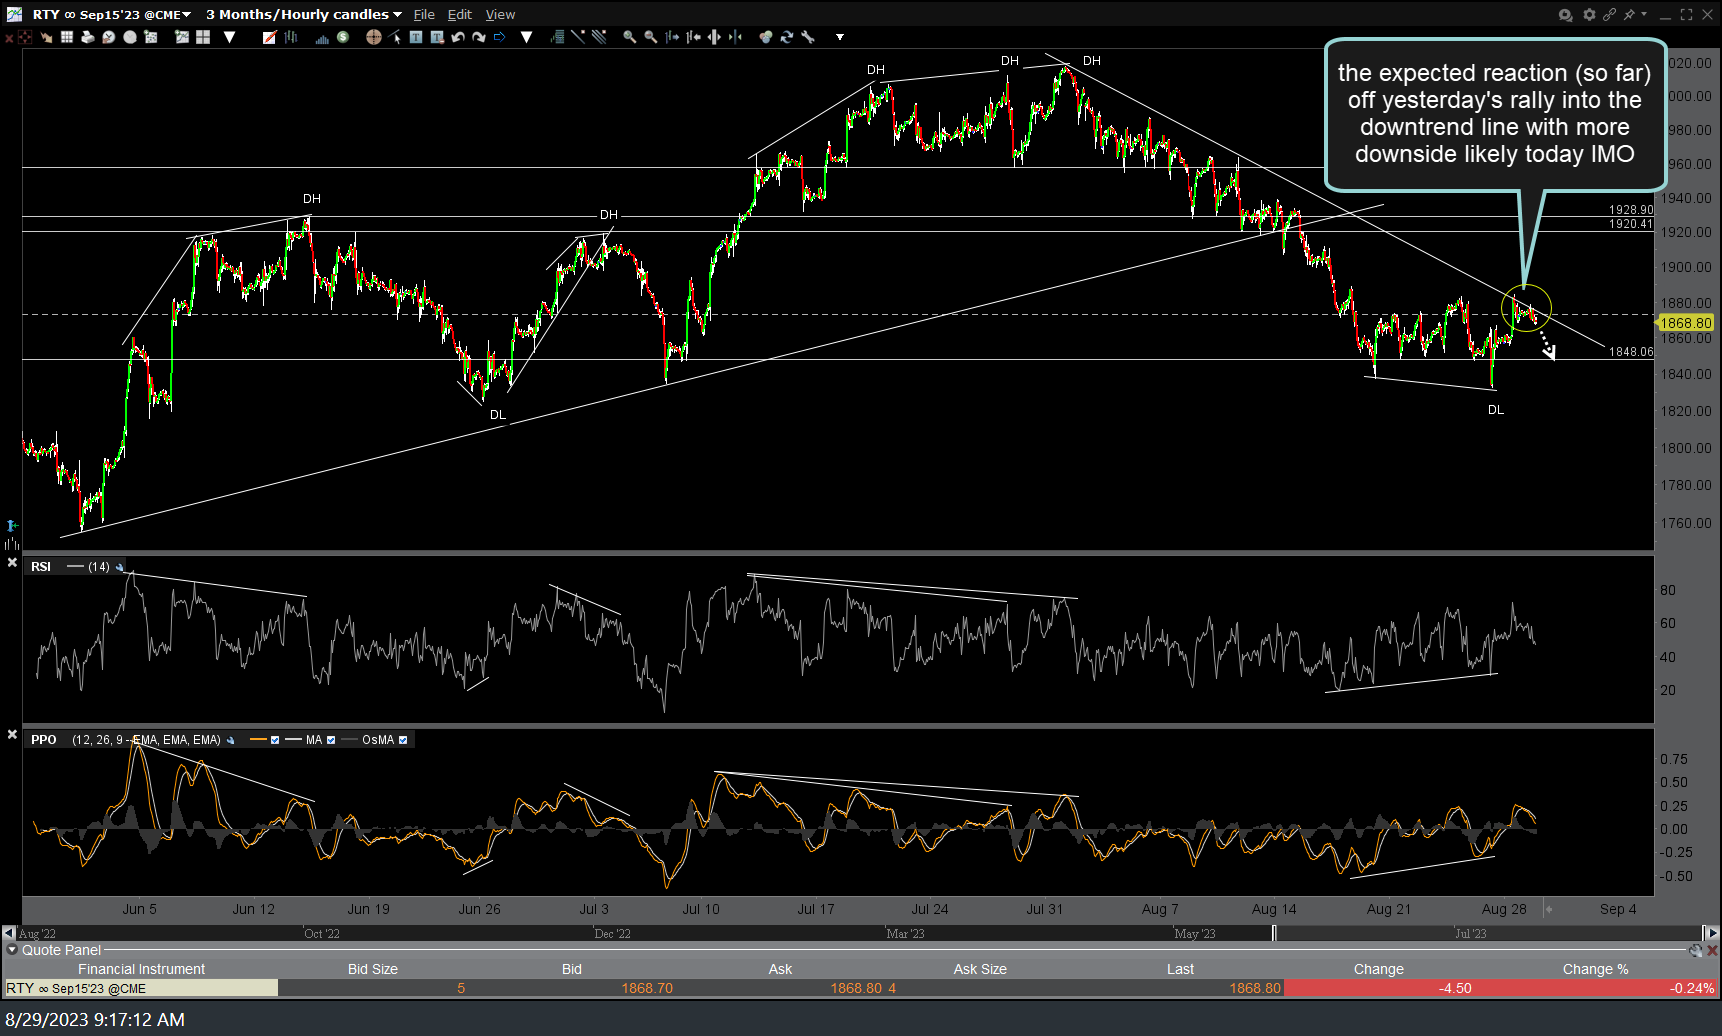
RTY 60m Aug 29th