
EUR/USD has rallied into the downtrend line (top of falling wedge pattern) on the daily time frame, with the typical reaction so far although a breakout in the coming days/weeks still appears likely. Previous (Aug 26th) & updated daily charts below.
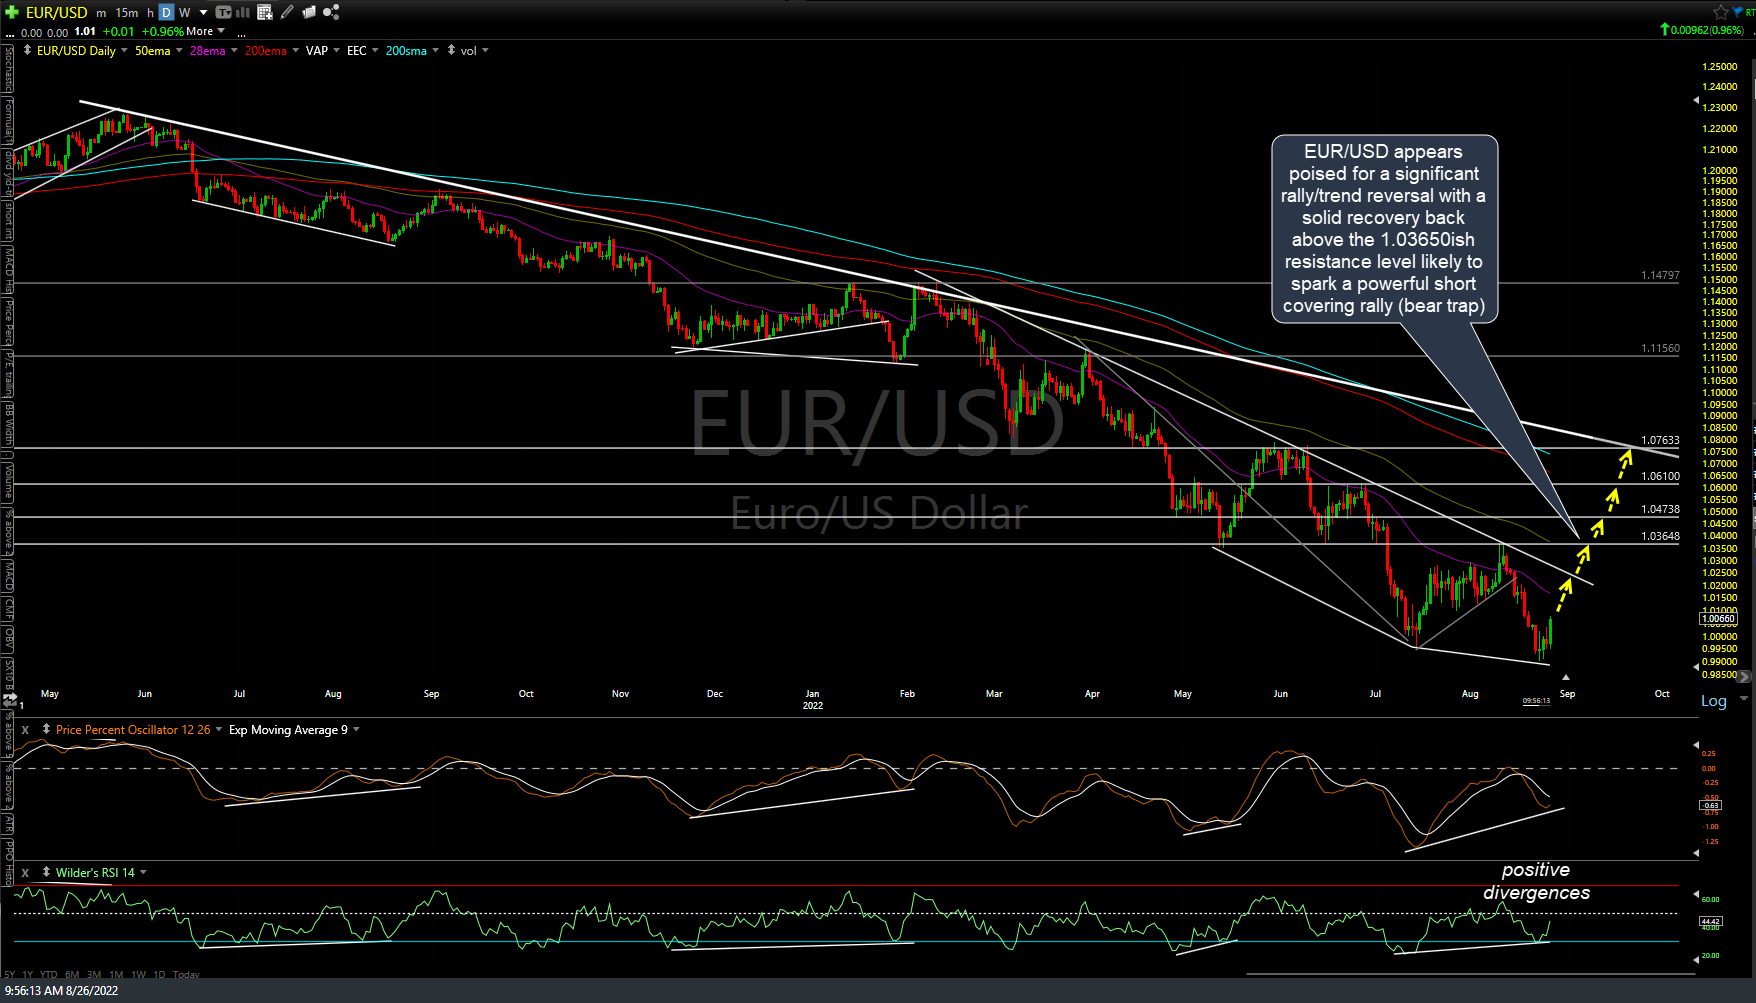
EUR-USD daily Aug 26th

EUR-USD daily Sept 12th
Zooming down to the 60-minute time frame, following the recent breakout of the smaller bullish falling wedge pattern, EUR/USD had reactions off the initial tags of both the 1.0133 & 1.01870 resistance levels, as expected, per recent videos with more downside in the US Dollar/upside in the Euro & precious metals likely in the coming days, weeks, & quite likely, months. Previous (Sept 8th) and updated 60-minute charts below.

EUR-USD 60m Sept 8th
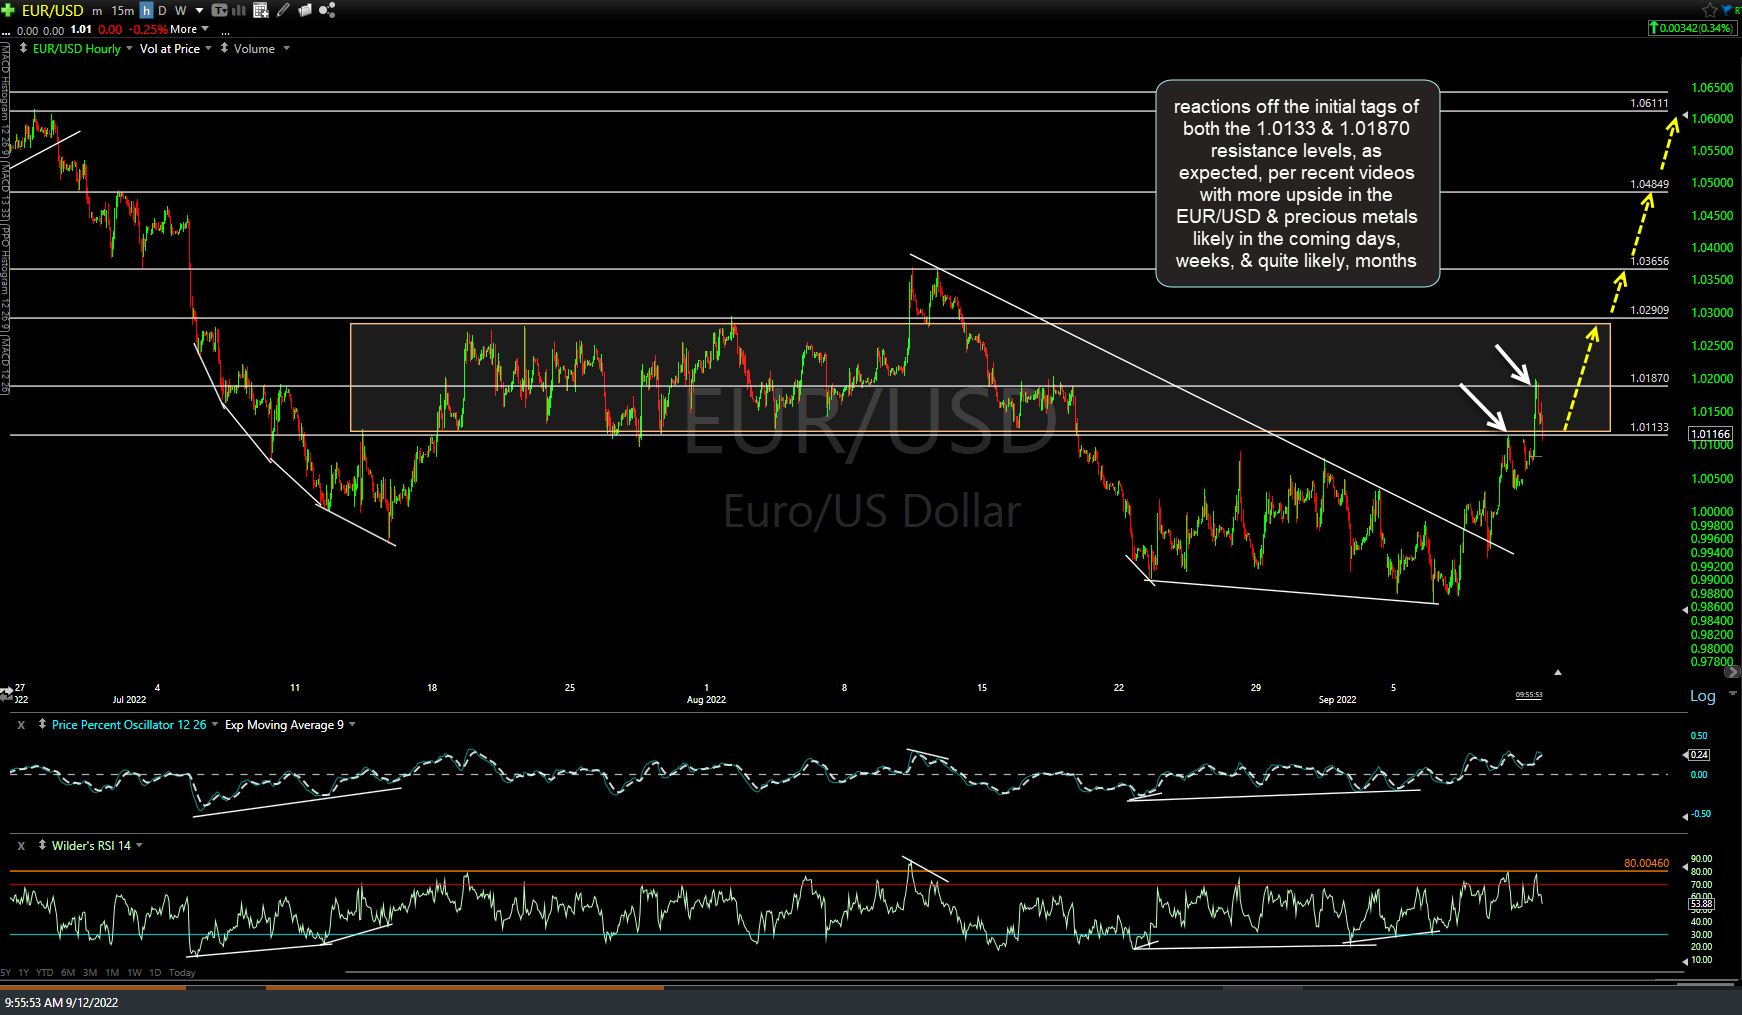
EUR-USD 60m Sept 12th
The 60-minute charts of /GC (gold futures) and /SI (silver) show the nearby support & resistance levels which will provide objective add-ons or entries (on pullbacks to support and/or breakouts above resistance) with more upside in both likely in the coming weeks to months.
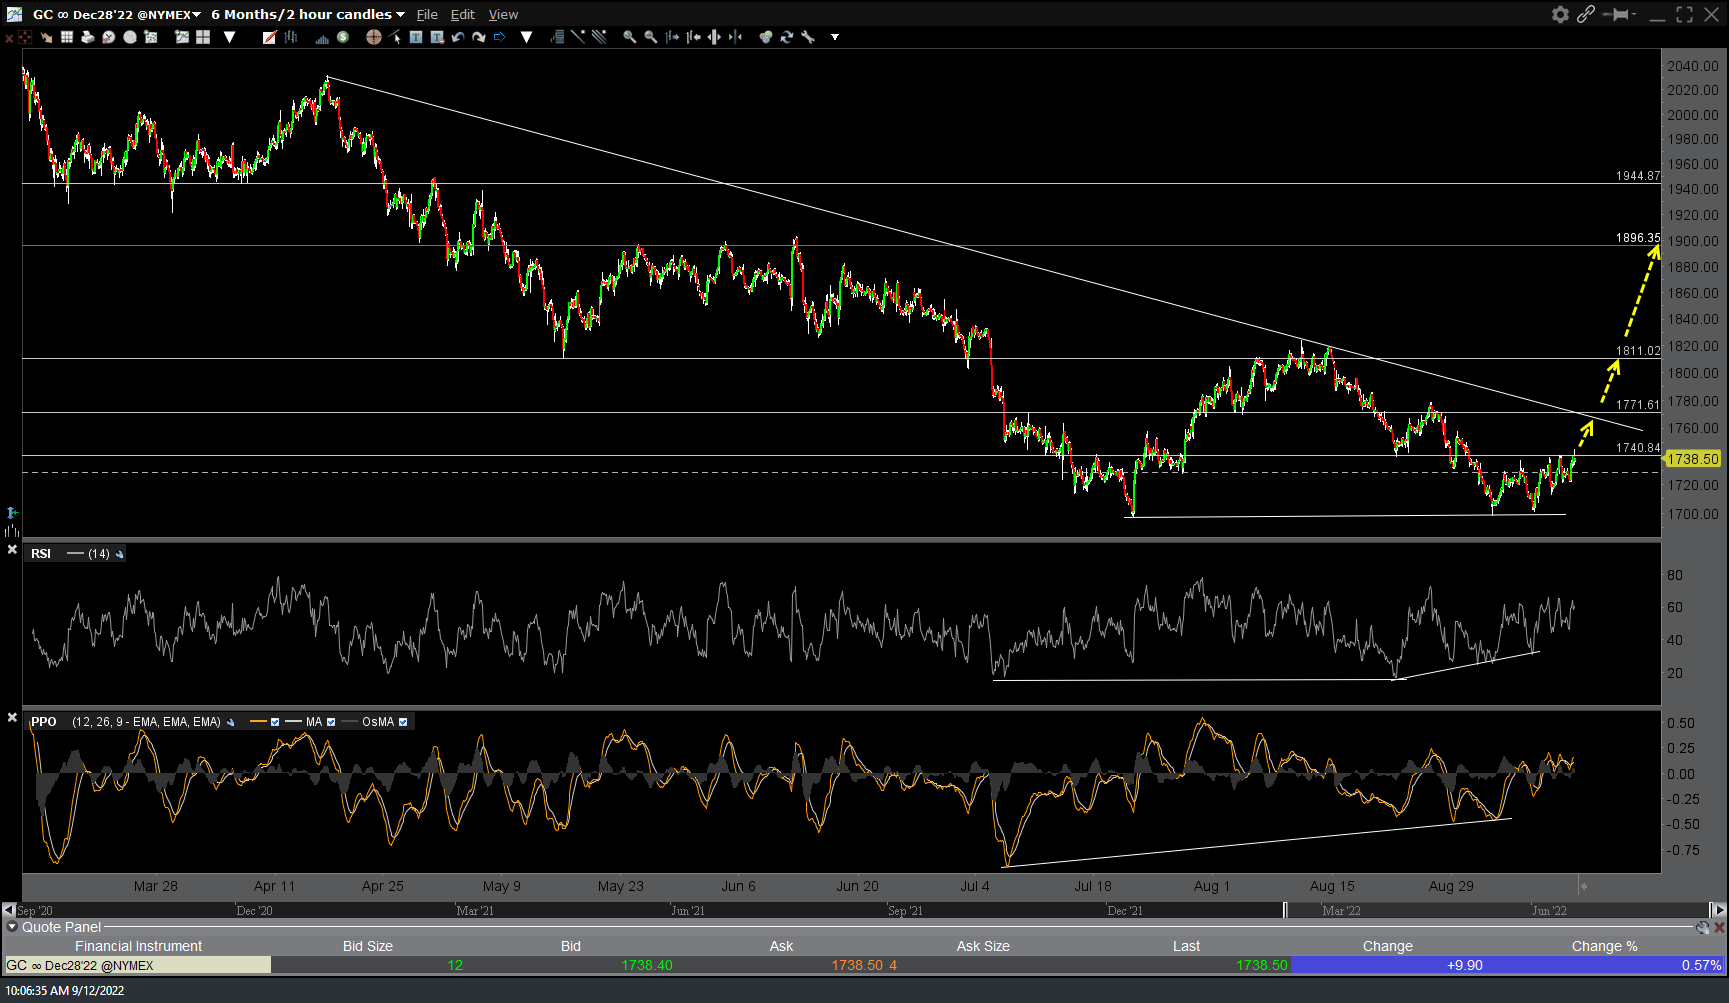
GC 60m Sept 12th
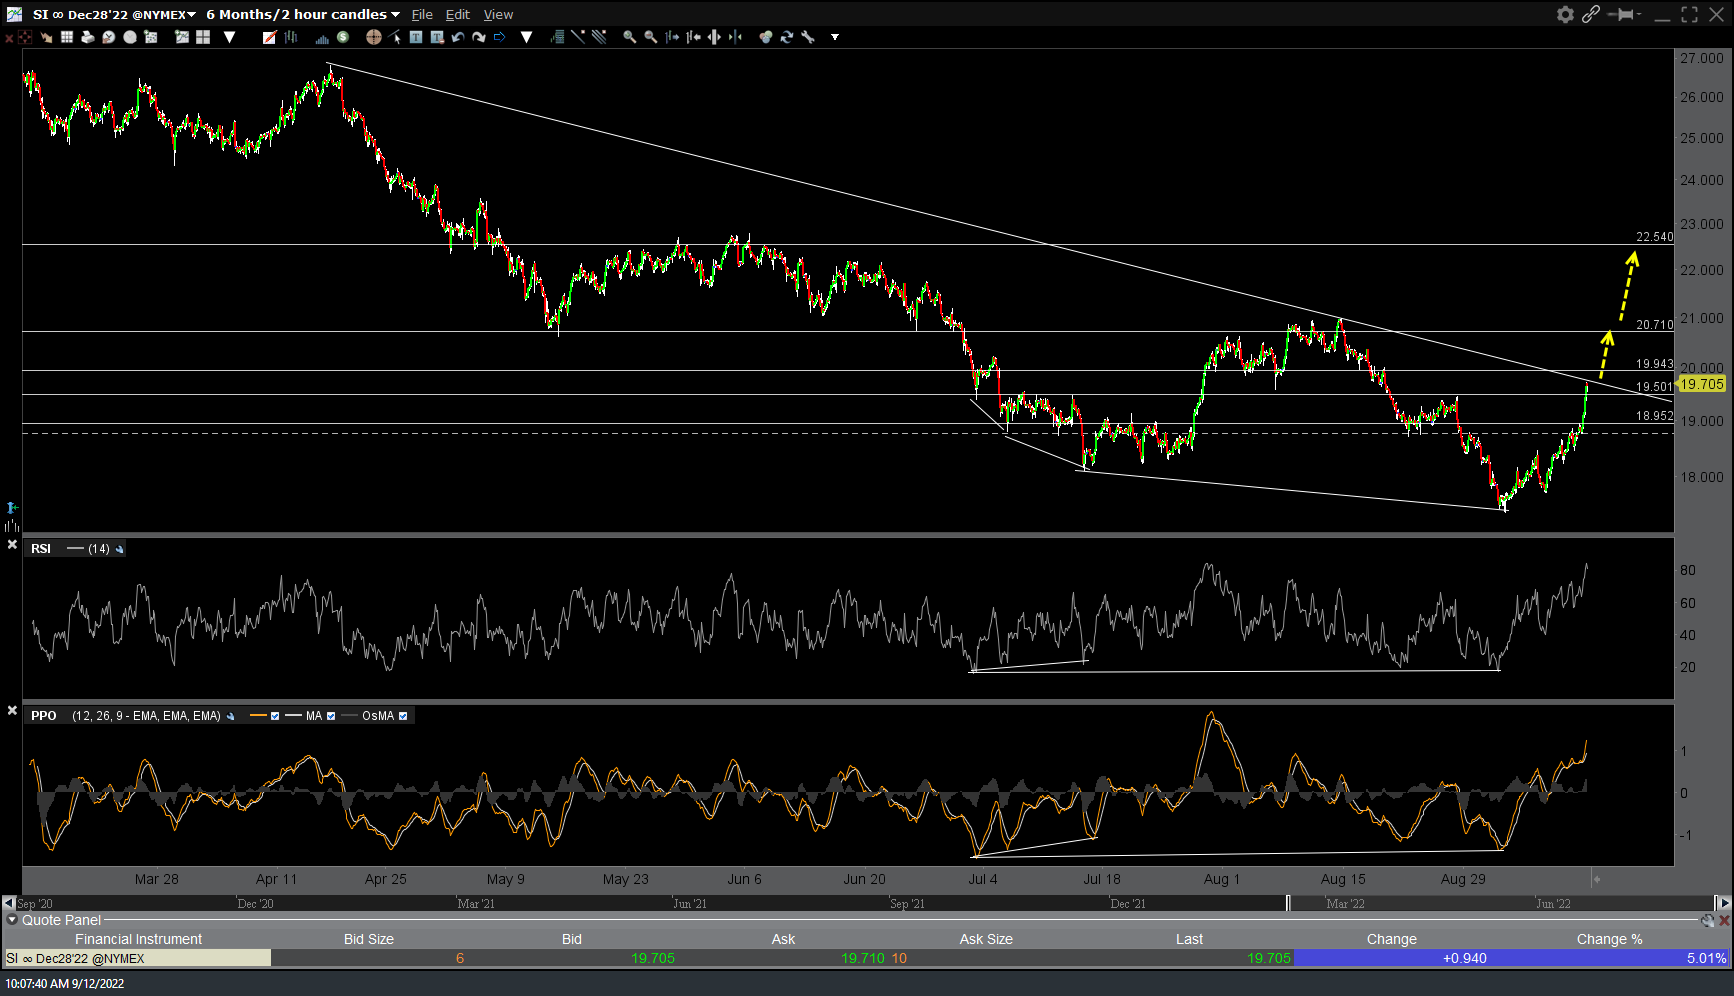
SI 60m Sept 12th