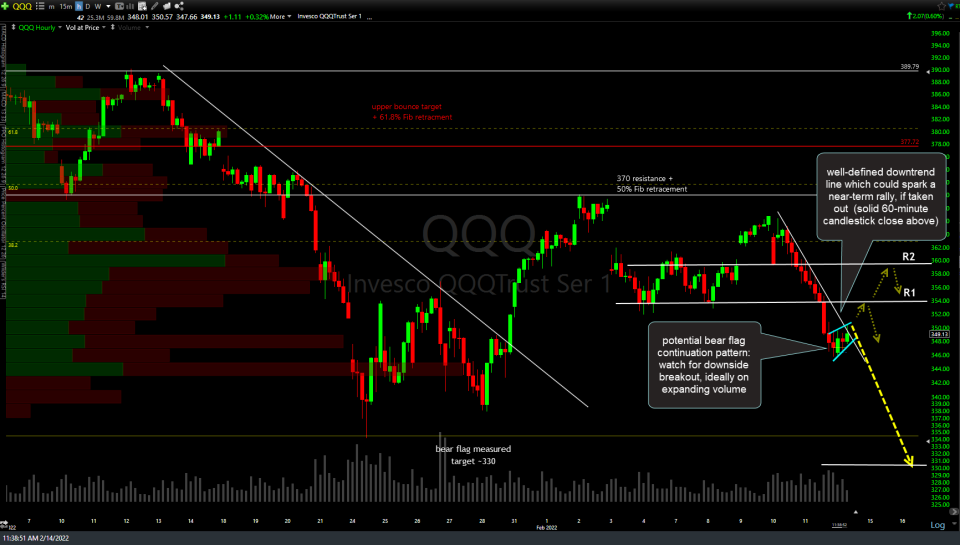
We have a potential bear flag forming on the 60-minute chart of QQQ so I’ll be watching for a downside break of the pattern, ideally on expanding volume. Should that potential continuation pattern play out, the measured target (length of the flagpole added from the top of the flag) would be around 330. On the flip side, the Q’s also have a well-defined downtrend line which could spark a near-term rally, if taken out (with one or two solid 60-minute candlesticks closes above). Should we get an upside breakout, likely end-points for any counter-trend bounce would be the R1 (first resistance) level around 354 and R2 around 359.50 with any push back to those levels offering objective short entries or add-ons.
QQQ 60-minute Chart 2-14-22
Share this! (member restricted content requires registration)
6 Comments


