
Ever since the Federal Reserve cut rates to zero back in March of 2020 in order to support the economy during the coronavirus pandemic and on many occasions since, including at the conclusion of the most recent FOMC meeting on January 27th, Fed Chairman Jerome Powell has consistently assured investors that there are no plans in the foreseeable future to raise interest rates as the central bank is not concerned of the risk of inflation pressures that might prompt them to raise rates anytime soon.
In my nearly 30 years working in the financial markets, I have yet to see a proactive Fed, rather a Fed that has consistently been reactive; behind the curve on raising rates only after asset prices have surged beyond reasonable valuations, creating their latest bubble (think dot.com late 90’s, housing/credit bubble late 2007, and now this..). Boom, bust. Boom, bust… with the Fed’s response to each market crash since 2000 to cut rates in order to spur economic growth (via lending), force money out of safe fixed-income investments (bonds, CD’s, etc..) into higher-risk equities, and boost consumer confidence via the wealth effect (rising stock market).
That has & continues to be a fairly simple yet effective strategy. The problem is that the Fed can only continue to cut rates are long as there is a rate to cut. In other words, they can cut a 10% Fed Funds rate down to 3%, as they did back in the late 80’s/early 90’s or from 7% down to 1% as they did when the dot.com bubble started to burst in 1999/2000 or even from 5% to 0% as they did when the housing/credit bubble began to burst in 2008.
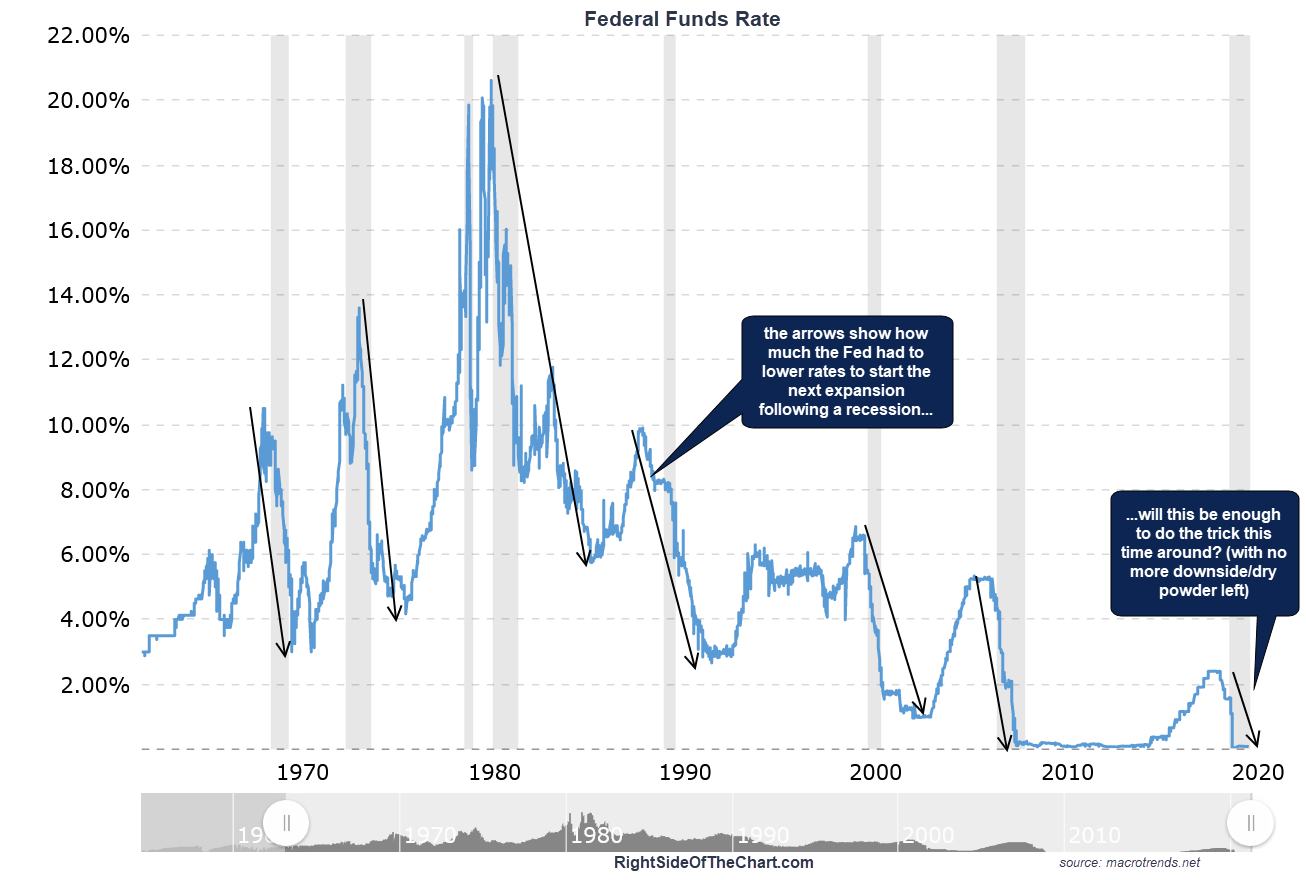
Federal Funds Rate Feb 5th
After taking rates to the floor back then, the Fed kept the pedal to the metal until late 2015 when they started to gradually try and dig themselves out of the ZIRP policy rut in order to reload on some dry powder for when it would inevitably be needed again. They managed to walk the Fed Funds rate back up to around 2.4% until the stock market (as predicted here in advance shortly before it happened) started to throw a hissy fit with the big 20%+ plunge back in the 4th quarter of 2018.
Just as a weak parent caves in to a child’s tamper tantrum to give them what they want, the Fed immediately pulled a 180, going from hawkish to dovish in response to the stock market’s Q4 ’18 hissy fit. Fast forward just over a year later & enter one of the worst pandemics the world has seen since the Bubonic plague that ravished Europe & Asia in the mid-1300’s. With economic shutdowns worldwide, the Fed had no choice but to use up what little dry powder they had (as well as a ton of powder they didn’t have.. via printing money) by taking rates back down to the floor.
Okay, so all that isn’t anything that most of us haven’t already heard or read about 100x over already. However, the thing that I’m surprised isn’t making front-page headlines is what I can only imagine is either a gross oversight by the Fed or an intentional talking down of not just the risk of the Fed’s extreme & excessive monetary policies potentially or ultimately resulting in inflation but rather the fact that inflation is & has been surging since the Fed went nuclear almost a year ago, despite what the convoluted & often criticized (for understating inflation) CPI is telling us.
The first chart below is the $CRB Index which is comprised of 19 commodities: aluminum, cocoa, coffee, copper, corn, cotton, crude oil, gold, heating oil, lean hogs, live cattle, natural gas, nickel, orange juice, silver, soybeans, sugar, unleaded gas, and wheat. The $CRB has rallied over 77% since last April, breaking out above the big 167ish resistance (formerly key support which was broken in late-February when COVID hit) and more recently, breaking out above the downtrend line off the May 2018 highs.
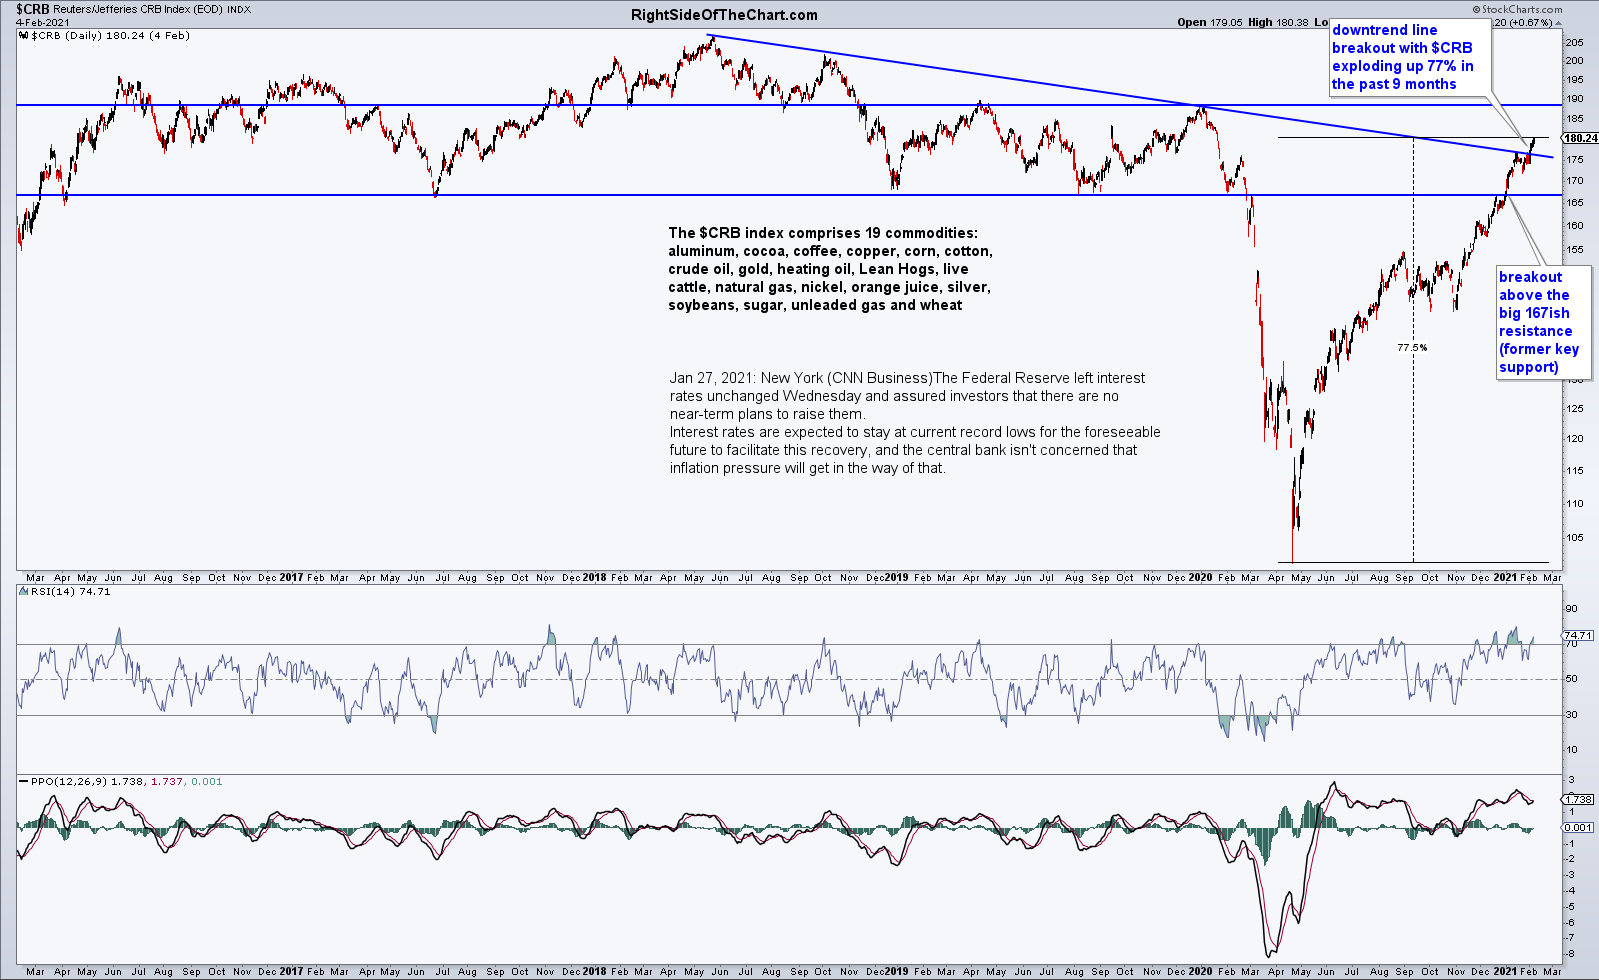
CRB Commodity Index daily Feb 5th
I suspect that breakout above the downtrend line in the $CRB may prove to be a momentum-fueled overshoot, with commodities pulling back in soon as the $CRB consolidates or pulls back from that trend (max. pullback target the 167 support level). However, as discussed in recent videos, it appears that the recent gains in most commodities over the past year or so, particularly the agricultural commodities which I have been consistently bullish on for the past year or so, is most likely the first leg up in a new bull market vs. a bear market rally.
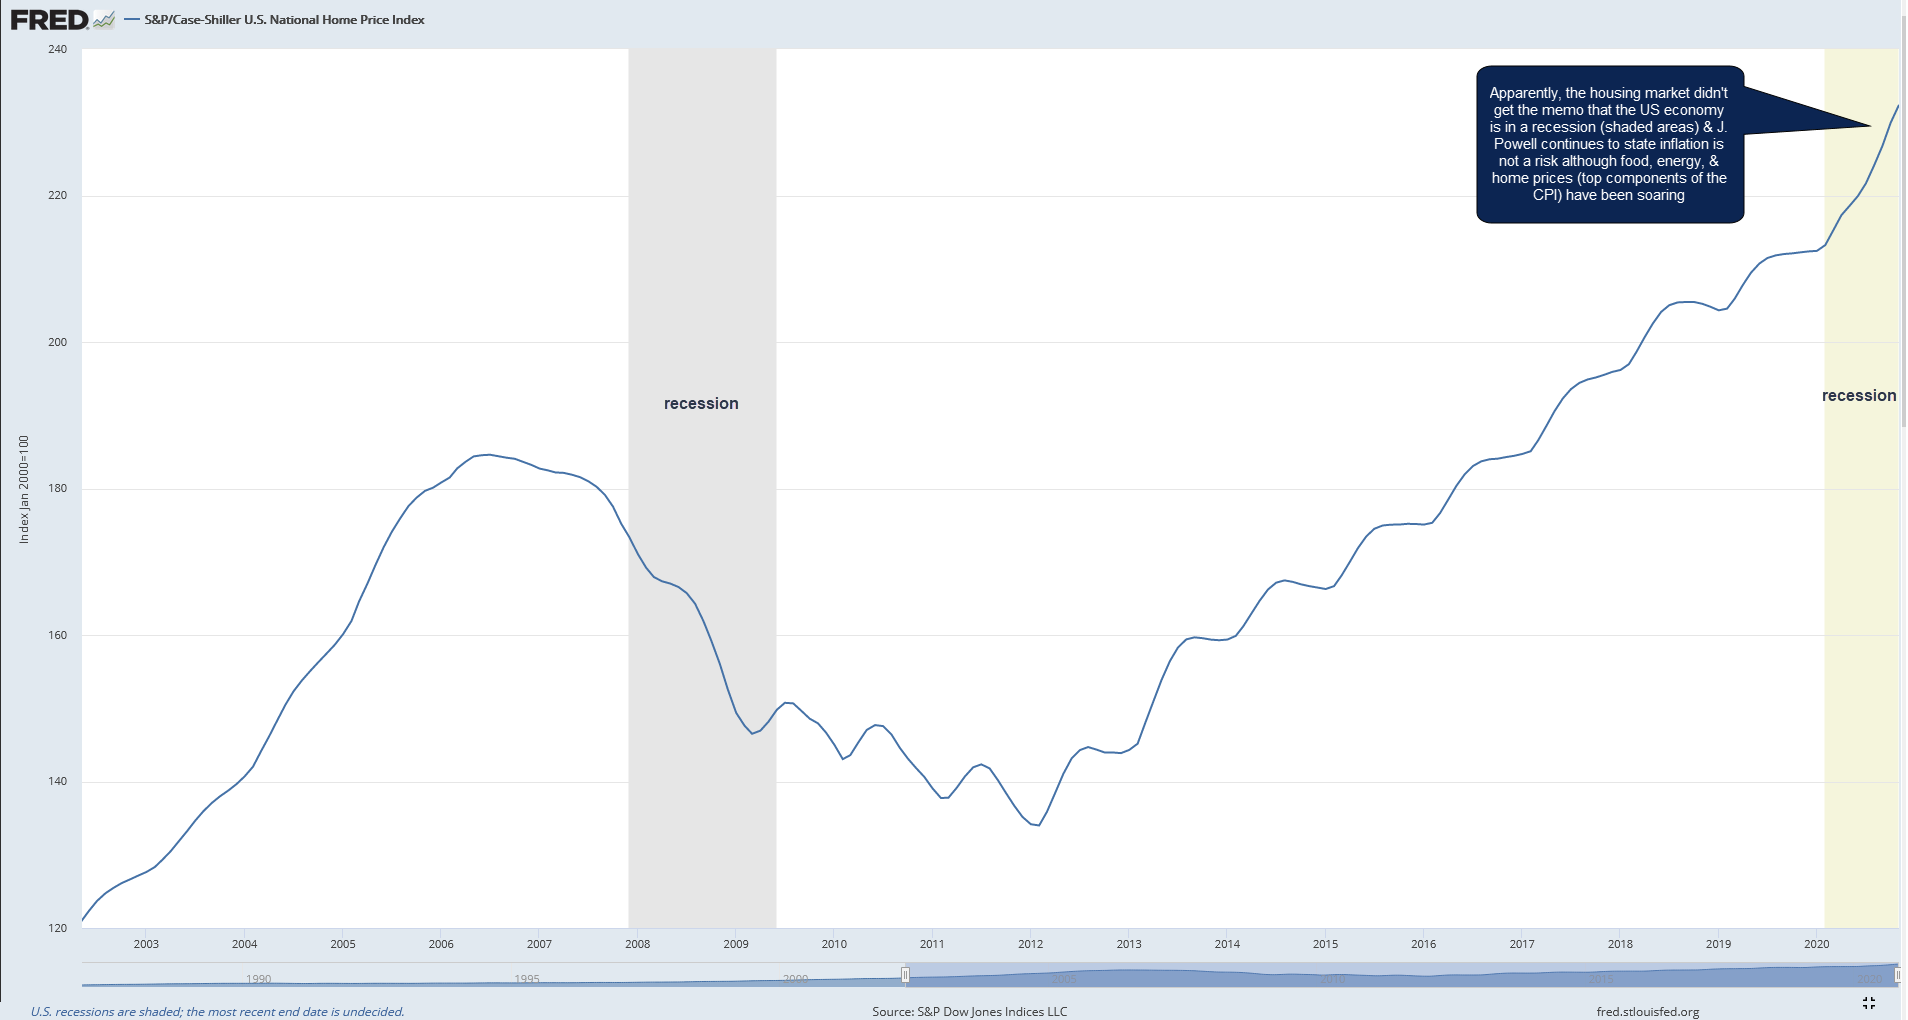
National Home Price Index 2-5-21
Along with food prices, housing as well as energy/transportation are among the largest contributors to the CPI (consumer price index), the most commonly used measure of inflation. How & why the recent surge in food, crude oil prices (up 768% since the April lows and back to it’s pre-COVID levels), as well as surging home prices (chart above) are not yet being reflected in the CPI is beyond me but it does jive with the long-standing criticisms of the CPI tending to understate inflation.
Last but not least, long-term rates have been moving sharply higher recently as the bond market clearly disagrees with Powell’s “inflation not a concern” statements. On the left of the chart below, not the current US Treasury yield curve (blue) compared to Feb 2020 (medium grey) in which long-term rates were roughly on par with short-term rates, essentially signaling that the bond market was not pricing in inflation. Since then, particularly in recent months, long-term rates have risen sharply with both the 10-year & 30-year bond yields mounting one of the strongest rallies in years since early August.
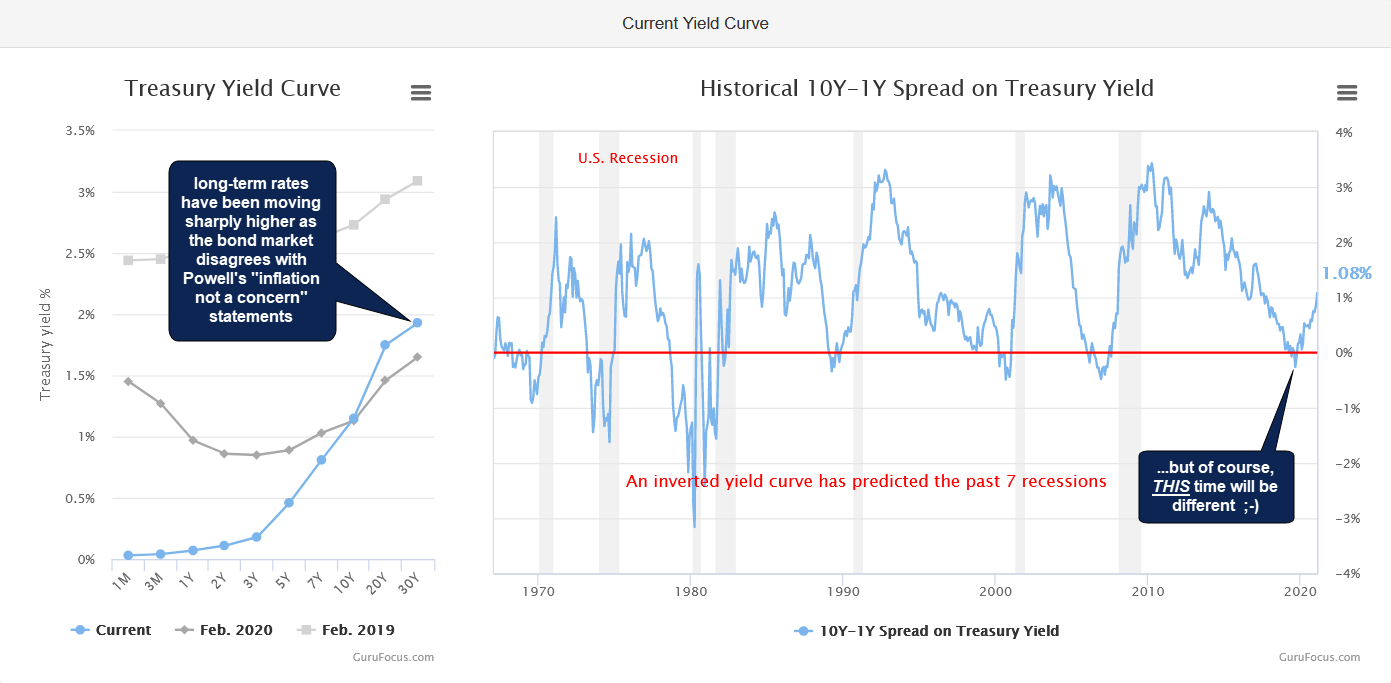
Yield Curve Feb 5th
Keep in mind that everything discussed above falls under the category of what I would call Macro-analysis. It paints the bigger picture and speaks to developments that are likely to impact the longer-term outlook of the financial markets (stocks, bonds, commodities, etc…) over the next several years. Everything mentioned above is fundamental analysis whereas the majority of the analysis & trade ideas posted on rsotc.com are based on technical analysis, i.e.- charting. Whereas fundamental or macro-analysis is useful in longer-term investing, technical analysis is required for Micro-analysis or predicting where a security is likely headed in the near-term (days, weeks, and/or months).
Technical analysis is also more useful, nay, absolutely necessary for timing entries & exits on a trade as bullish or bearish fundamentals on a stock or commodity could & often do take many months or even years to play out. As of now, the trend in the stock market is bullish with last Friday’s breakdown below the primary uptrend line in QQQ proving to be a whipsaw signal as the Q’s quickly snapped back above the trend line and appear poised to close the week comfortably back above it.
Based on what appears to be a clear & fairly strong trend of inflationary forces on the largest components of the CPI (food, energy, and housing), unless we get a significant correction or lasting trend reversal in any or all of those soon, I would suspect that we’ll soon start to see the early signs of J. Powell back-peddling on his “inflation is not a risk” views. My best guess is that the Fed will at first very gradually start to shift away from their current uber-dovish stance via some of the Fed governors citing their individual concerns about inflation with a gradual shift (increase) in the Fed Fund futures, ultimately with Chairman J. Powell doing the same. Hard to say when that time will come although it will be sooner than later if energy, food, & housing prices (not to mention the ever-growing asset bubble known as the stock market) continue to climb.