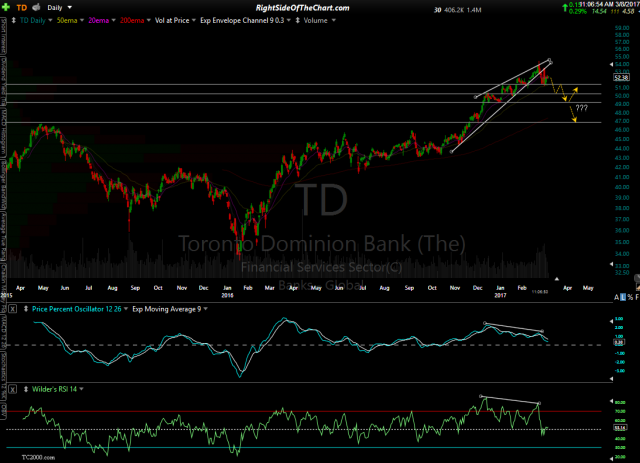
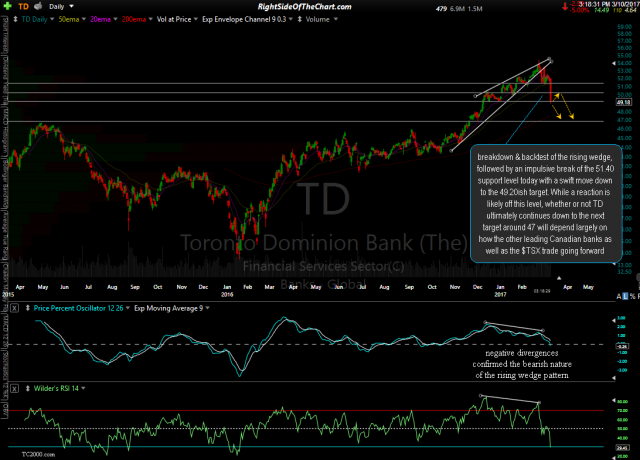
This is a follow-up to the outlook for the Canadian bank sector published on Wednesday as well as a request from @lee1 for analysis on the $TSX. So far, one of the 3 major Canadian banks covered in that post has already went on to play out for the 5-6% correction that was expected, with TD (The Toronto Dominion Bank) trading down exactly 5% so far today and not by mere coincidence, dancing on that horizontal support/target level around 49.20 for most of the afternoon so far today. Posted below are Wednesday’s & today’s daily charts for TD:
- TD daily March 8th
- TD daily March 10th
Today’s updated chart shows the recent breakdown & backtest of the rising wedge, followed by an impulsive break of the 51.40 support level today with a swift move down to the 49.20ish target. While a reaction is likely off this level, whether or not TD ultimately continues down to the next target around 47 will depend largely on how the other leading Canadian banks as well as the $TSX trade going forward. As of now, BNO (The Bank of Nova Scotia) and BMO (Bank of Montreal) are holding up as the catalyst for today’s move down in TD was news driven although also it was also very much already reflected in the charts & also a technically driven fall as the news was simply the catalyst that caused the stock to break below support & trigger the next wave down following the recent wedge breakdown & backtest.
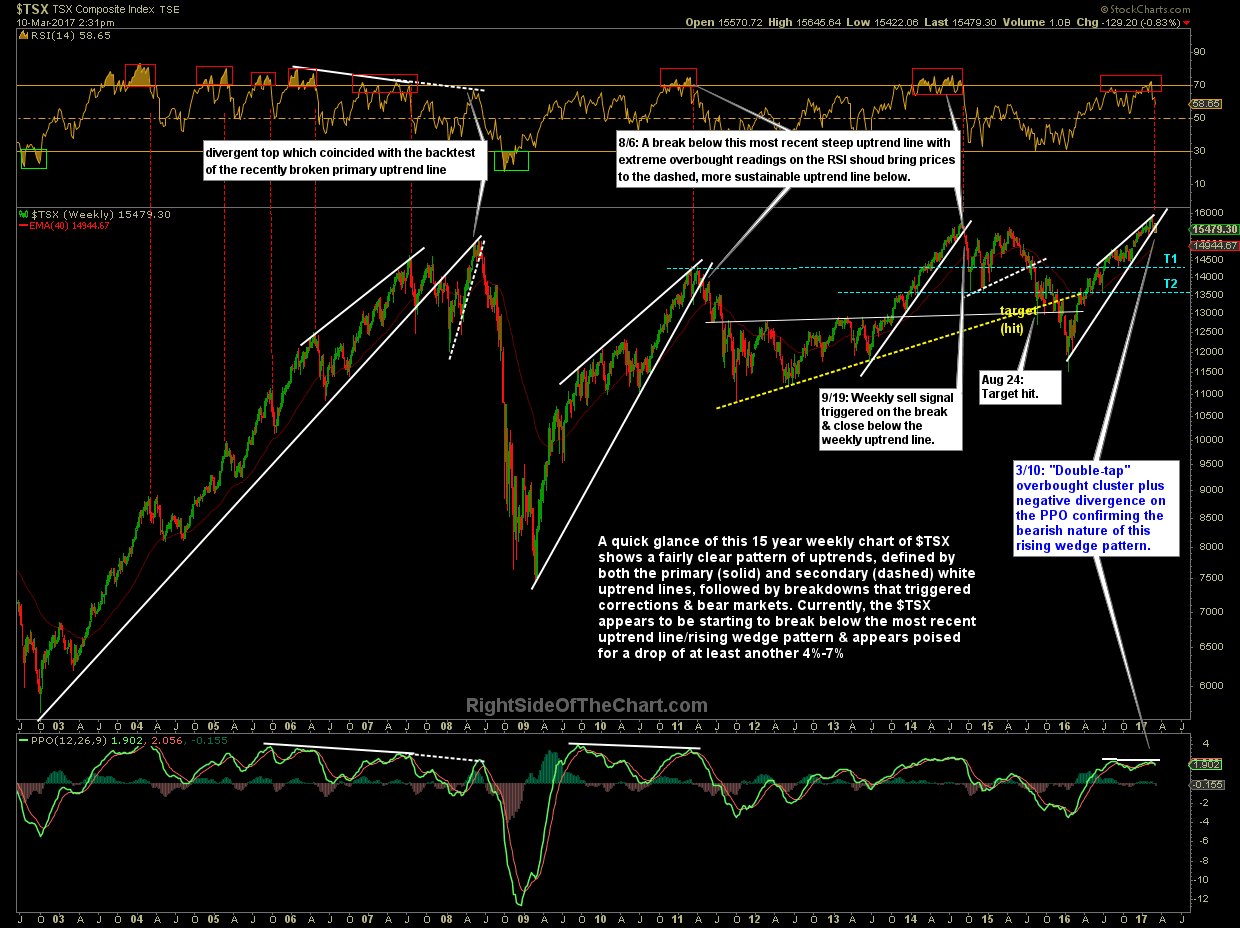
While there may appear to be a lot of moving parts on this 15-year weekly chart of the $TSX (S&P/TSX Composite Index), a quick glance shows a fairly clear pattern of uptrends, defined by both the primary (solid) and secondary (dashed) white uptrend lines, followed by breakdowns that triggered corrections & bear markets. Currently, the $TSX appears to be starting to break below the most recent uptrend line/rising wedge pattern & appears poised for a drop of at least another 4%-7%. Adding to the bearish outlook for the $TSX is the recent ‘double-tap’ cluster of overbought readings on the RSI located at the top of the chart. Such overbought clusters in the past were almost always followed by corrections or bear markets ranging from about 7-50%.


