
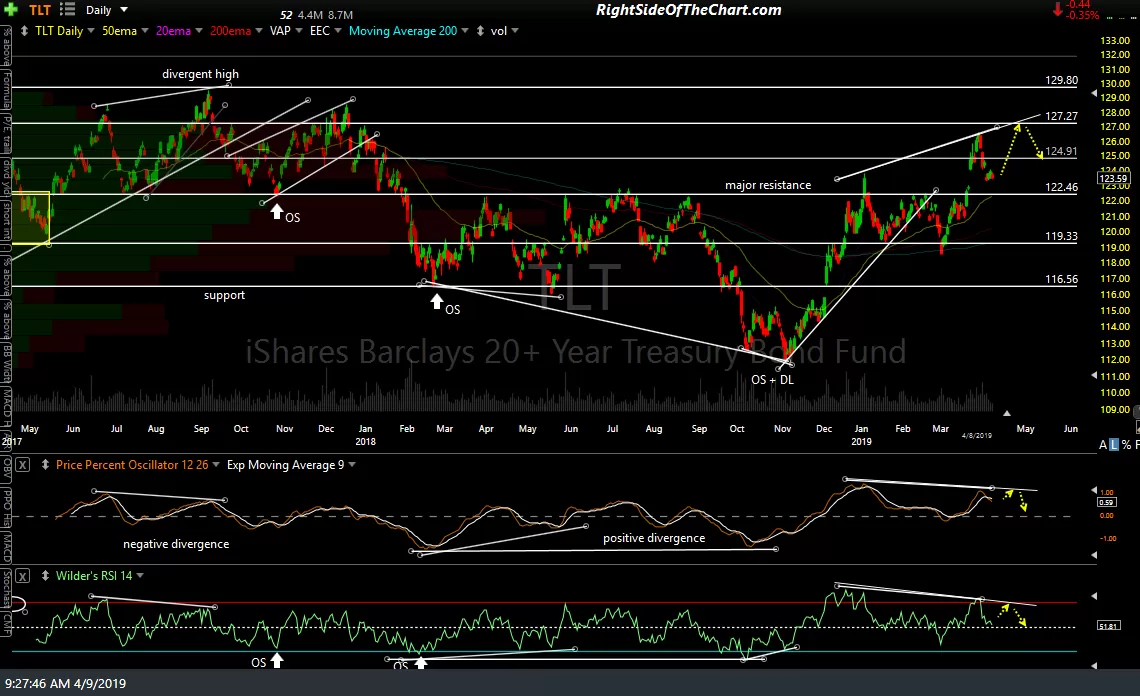
/ZB (30-yr US Treasury Bond Futures) just reversed off support with bullish divergence followed by a breakout & backtest of the downtrend line off the late March highs & appears to be headed for another run at or near the recent highs. That high was a divergent high on TLT (20+ yr T-Bond ETF) with TLT correcting to nearly backfill the big March 22nd gap, which was a breakout gap above the key 122.50ish former resistance, now support level.
-
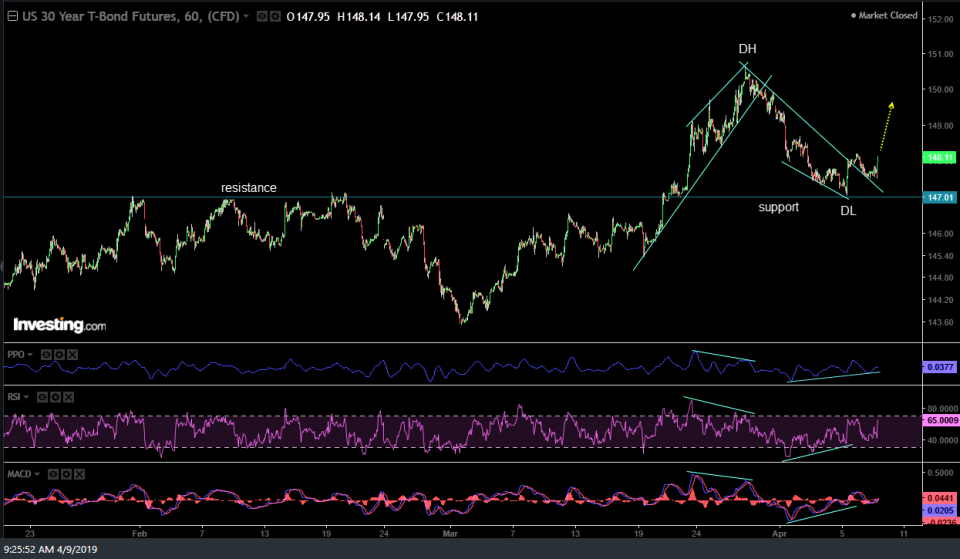
- ZB 60-min April 9th

-

- TLT daily April 8th close
Should this scenario of a tradeable thrust higher in /ZB and TLT over the next week or more play out, besides a swing trading opp (longs on either), it would also most likely coincide with a correction in the stock market, foiling what appears to be a done deal for a breakout to new all-time highs in the major stock indices.
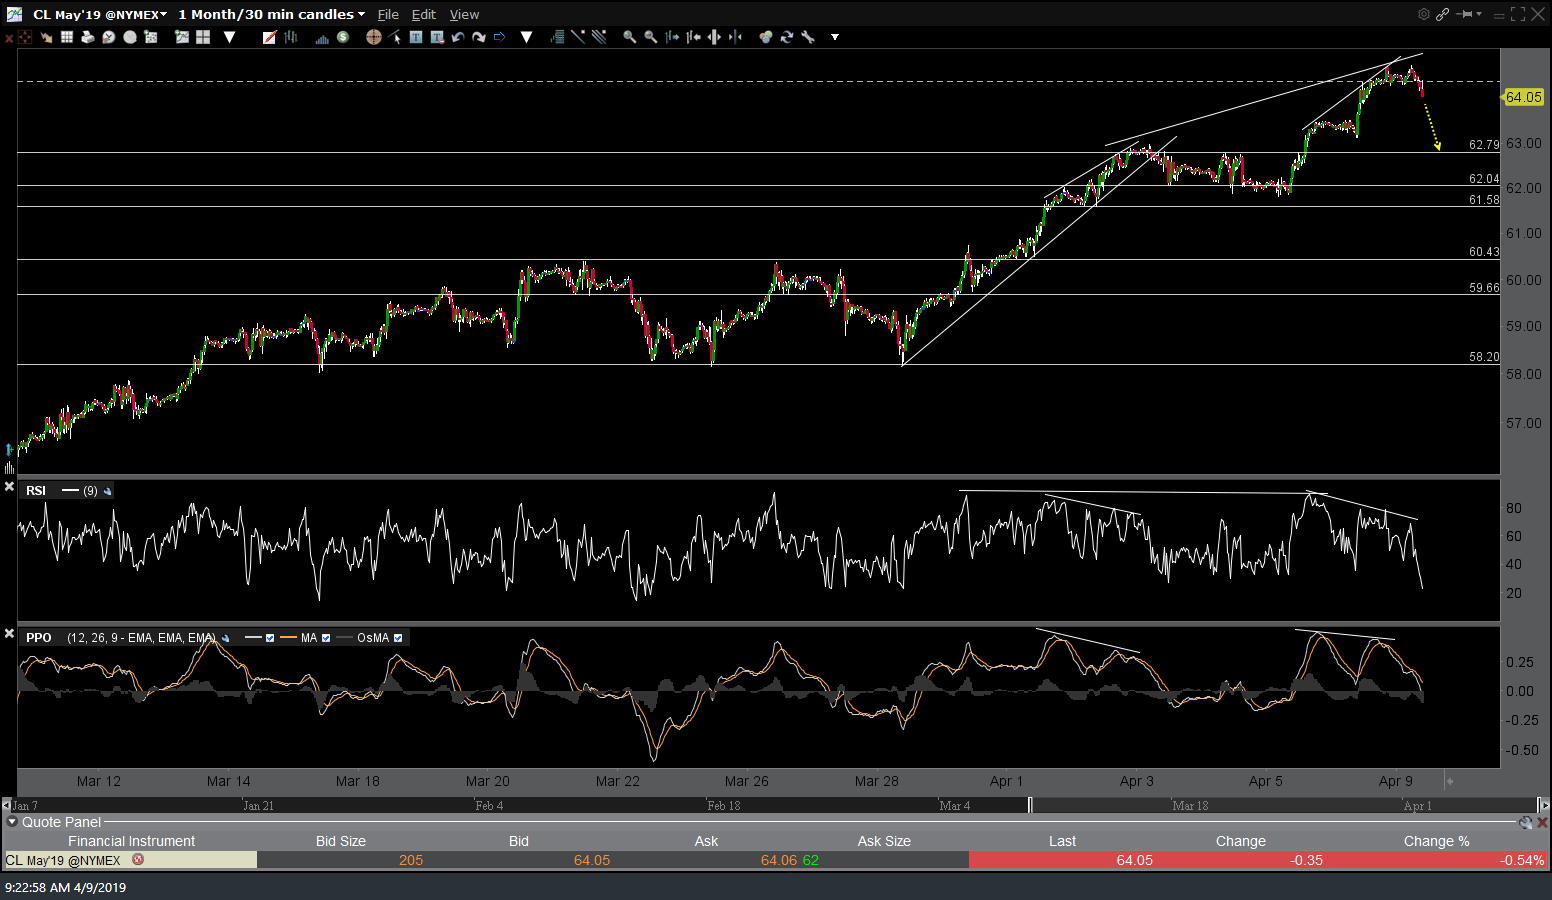
CL 60-min April 9th
/CL (crude oil futures) appears poised for a pullback to at least the 62.80 level following this most recent 60-minute divergent high which also coincided with overbought conditions on both the 60-minute & daily time frames. Should the pullback scenario in crude also play out, that would also most likely align with weakness in the equity markets as the correlation between crude oil & the stock market has been positive for many months now.
I must add, however, that despite the numerous red flags on this rally such as unusually low volume & deteriorating market breadth, the price action has been usually resilient and it would be quite atypical for the market not to make at least a test or minor punch above the 2018 all-time highs with as close as it has come so far. Both the stock market & crude oil have been shrugging off minor divergences & sell signals on the 60-minute charts for months now & even climbing while the larger, much more significant divergences & overbought conditions on the daily time frame continue to build. As such, I would be remiss not to point out these developments, whether the odds of the two scenarios in Treasuries & crude oil playing out are below average or not.