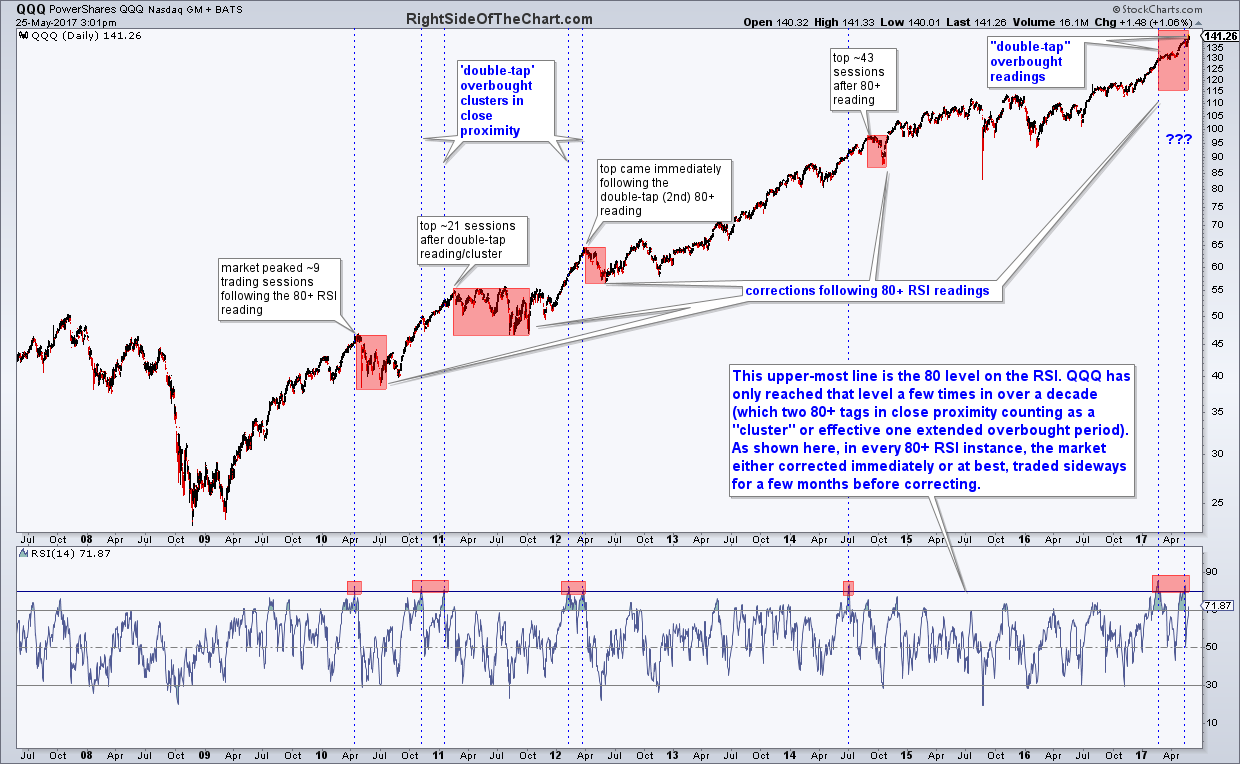
I had recently shared a previous version of this daily chart of QQQ highlighting the very rare extreme overbought conditions (80+ on the RSI) that have only occurred on a handful of occasions in more than a decade. Those 80+ reading were either stand-alone reading or what I refer to as “double-tap” readings; 2 consecutive readings in relatively close proximity. I’ve also updated this chart to show the range in lag time between the 80+ RSI extreme peak (or second reading if a cluster occurred) & the number of trading sessions before the ensuing corrections. Those previous tops before a significant correction ranged from nearly immediately to about 43 trading sessions. As of about 10 days ago, we just put in another “double-tap” cluster. Far from an exact timing indicator but I believe this speaks to the risk/reward in the market at this time.
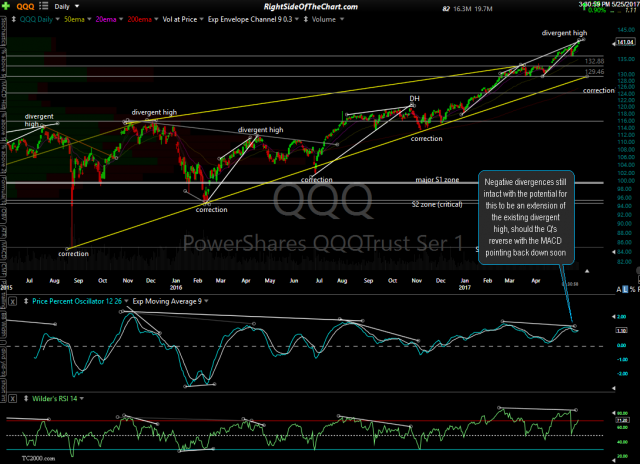
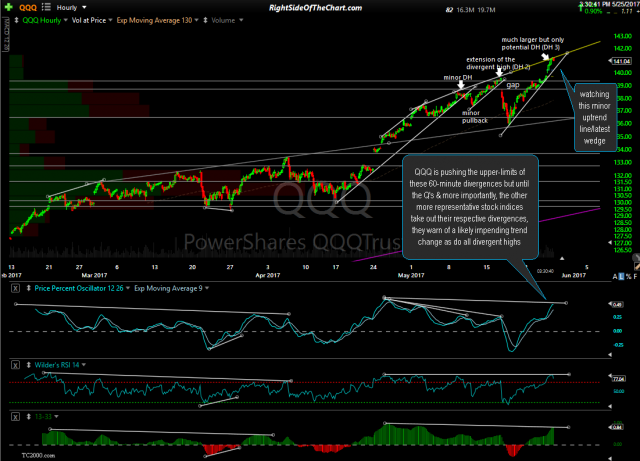
Nothing says that we can’t get a third or even forth reading soon nor can we say that the market must correct as it did in the past following the previous extreme overbought readings. All we can say is that in the past, that is what has occurred & technical analysis is all about identifying patterns & events that have previously occurred & resulted in, with a fair degree of regularity, a particular outcome. The negative divergence that have been highlighted on the daily & 60-minute time frames (on all stock indices) are still intact, albeit by a slight margin on QQQ. Divergences, just as with overbought readings, are not a sell signal & although last Wednesday’s large red candle appeared to have potential, there was never any follow-through via an additional red candle, which is ideal to confirm any single 1-day bearish candle when the charts indicate that an uptrend is losing momentum. The updated 60-minute & daily QQQ charts are below but keep in mind that although any considerable upside in QQQ from here is likely to negate, or take out those divergences, the negative divergence on the significant daily time frame of all other major indexes, all of which are much more diversified & representative of the entire stock market & not just the tech sector + Amazon. More on the “other” indices later.
- QQQ daily May 25th
- QQQ 60-min May 25th
Although I spread my positions out among long & shorts & among various sectors & asset classes, I’m still feeling the pain on one of my two index shorts, $NDX (with the other, $RUT, holding its own today). $NDX is not an official trade idea & won’t be until we get some additional sell signals but I still very firmly believe that the risk to reward ratio in QQQ, despite one of the most resilient trends in years, is extremely poor on the long side with limited upside compared to the potential for a sudden swoon down that could easily wipe out weeks & even months of the previous gains in just days.
As always, trade according to your own objectives, risk tolerance, trading style & outlook for the market or a particular security. More importantly, when in doubt, stand aside (in cash). Just sharing my thoughts & how I see things at this time although I will say that the overbought extreme cluster highlighted below is far from the only reason that I remain short the NDX as the position is now well underwater. Although it is getting close to unraveling, I still see the same bearish developments that were in place last week with that preceded the sharp 1-day selloff that wiped out over 2 weeks of previous gains. If & when those existing divergences & other warning signs dissipate, so likely will my expectation for a significant correction in the coming weeks.


