
Just to summarize for the Silver Members that do not have access to the trading room as well as any Gold Members that haven’t had a chance to catch up on the comments posted recently, here’s a brief recap of what has transpired. Shortly before the close yesterday, in response to an inquiry about the late session rally into the close, I posted the following reply:
The US equity markets are quite oversold on the shorter-term time frames. For the market to take breather here or maybe even rally tomorrow is perfectly normal price behavior, even if they are headed much lower in the coming weeks. As of now, nothing has changed in the intermediate to longer-term technical picture but we’ll just have to see what the rest of the week holds.
Shortly after the open today, as the market was rallying into a key resistance level, I had posted the following comments along with this 30-minute chart of the SPY:
Likely ending point for the near-term oversold, counter-trend rally that started towards the end of yesterday’s trading session & carried over into early trading so far today.

SPY 30-minute June 15th
Now fast forward to the close today & what we can see is that the SPY stalled nearly all day while backtesting the Right Angled & Ascending Broadening Wedge pattern all day without a single 60-minute close above (even the FOMC induced pop failed to close above, as the initial reaction to the FOMC decision is that candlestick wick into the pattern) . The impulsive red closing candlestick confirms the bearish nature of the rejection off that backtest of former support, now resistance. As such, the odds are pretty good that the small rally that started late yesterday & carried over into this afternoon has likely run its course with a resumption of the downtrend kicked off by that impulsive candlestick in the last hour of trading today.
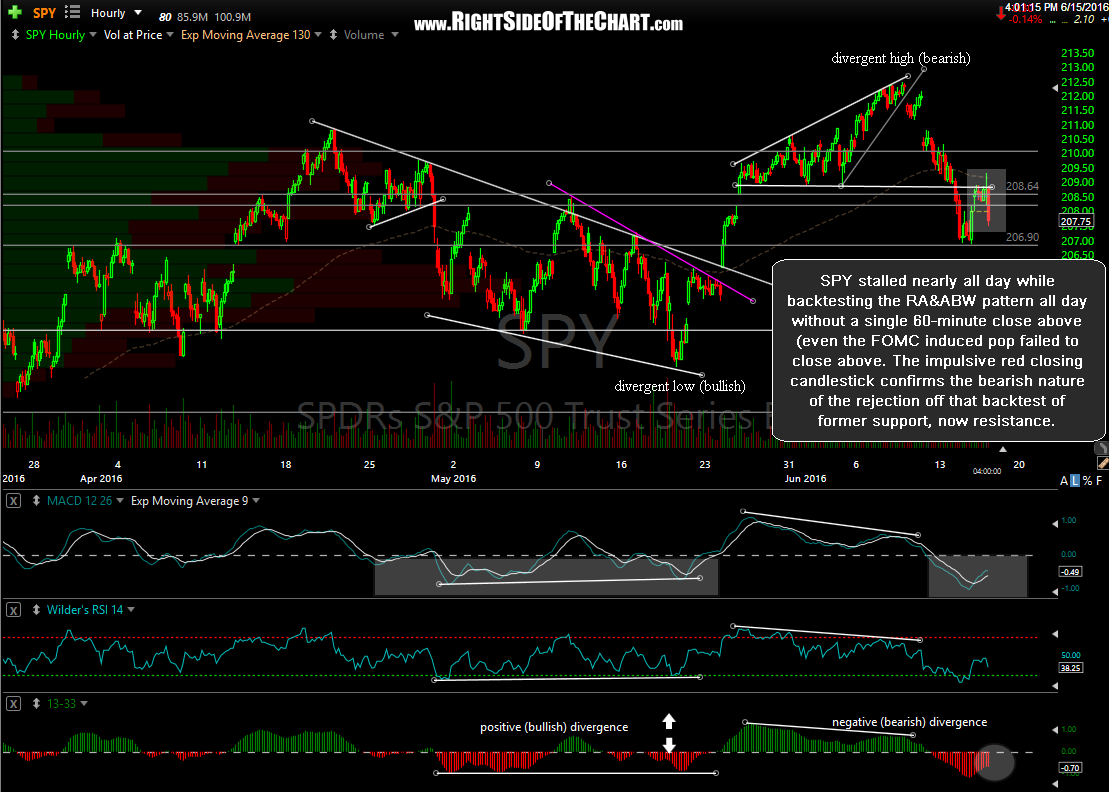
SPY 60-min 2 June 15th