
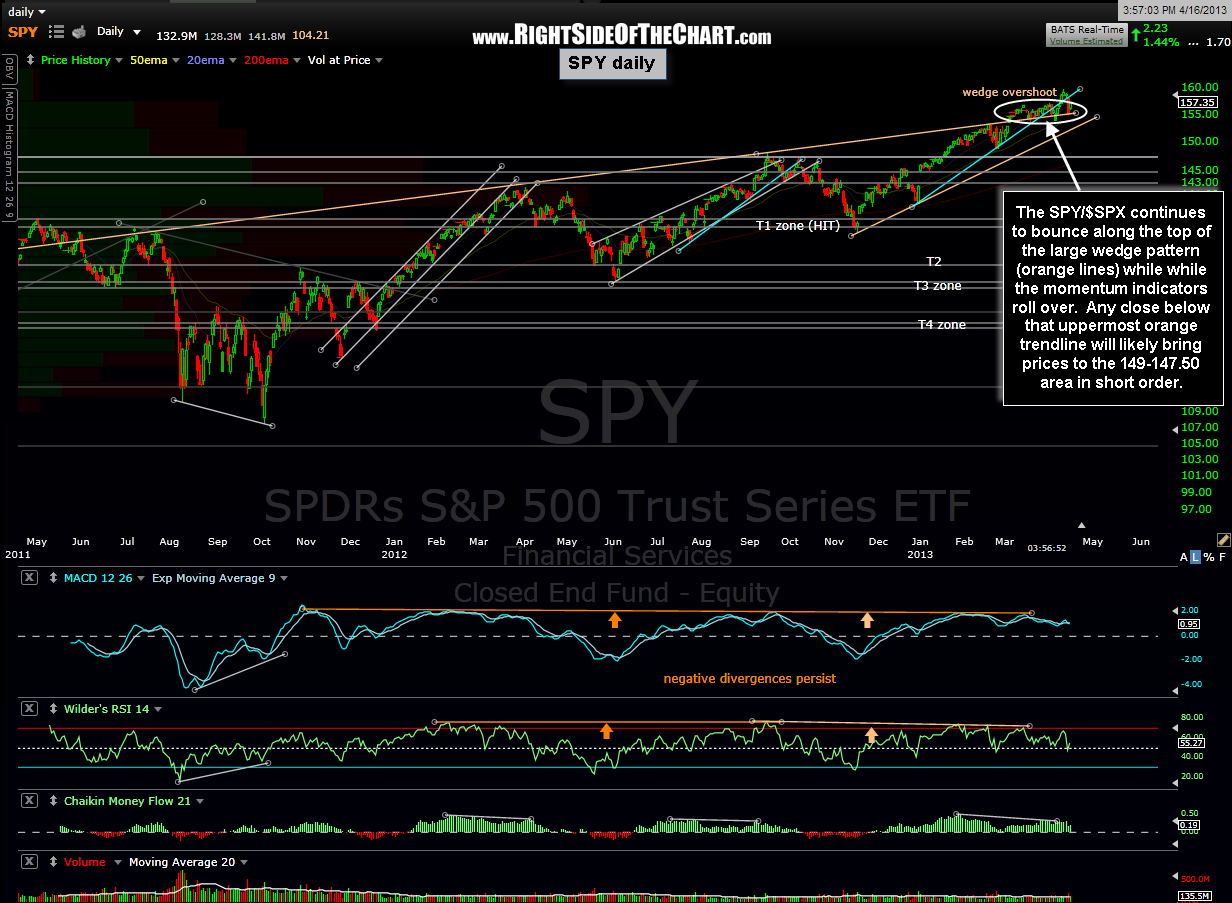
 Here’s the updated daily chart of the SPY highlighting how prices have continued to find support on the top of that previously posted wedge pattern (orange trendlines). In fact, ever since breaking out above the top of the pattern back on March 5th (which will likely prove to be a wedge overshoot, with prices soon falling back into and below the pattern), the SPY came back to test the top of the pattern from above on March 18th and has managed to close right on or just above that trendline in all but a few of the 30 consecutive trading sessions since then, including two intraday breaches but not a single close below that support line…yet. Therefore, I am closely monitoring this key leading index for any solid intraday break or close below that level as such an event could likely be the catalyst for a relatively quick move down to the 149 – 147.50 area.
On an admin note: We continue to work on rolling out the new email notification system. As is often the case with technology, we have run into a few programming issues that need to be worked out but a notification will be posted on the site as soon as the improvements are up and running. For those who were previously subscribed to receive notifications on specific categories vs. all posts, we hope to have that feature restored with the new changes.