
 As the talking heads on Bubble TV cheer the new intraday highs in the $SPX, I figured that this would be a good time to post an update on the current Russell 2000 short trade. Although I am a bit surprised and somewhat concerned by the resiliency of most major US indices over the last week, as of now, the IWM short/TZA-TWM long trade still looks fine. Although the revised price target for TZA following the 1:4 reverse split in TZA was recently updated, I neglected to post the revised stop level. The TZA trade was entered at 9.37, which gives a post-split adjusted entry price of 37.48. As the original suggest stop was $1.00 below entry, the new split adjusted stop will be $4.00 below the adjusted entry price (new stop 33.48), which still provides this trade with an attractive 3:1 R/R, or risk-to-reward ratio. Of course, every trader should use stop criteria which are commensurate with their own unique trading style and risk tolerance.
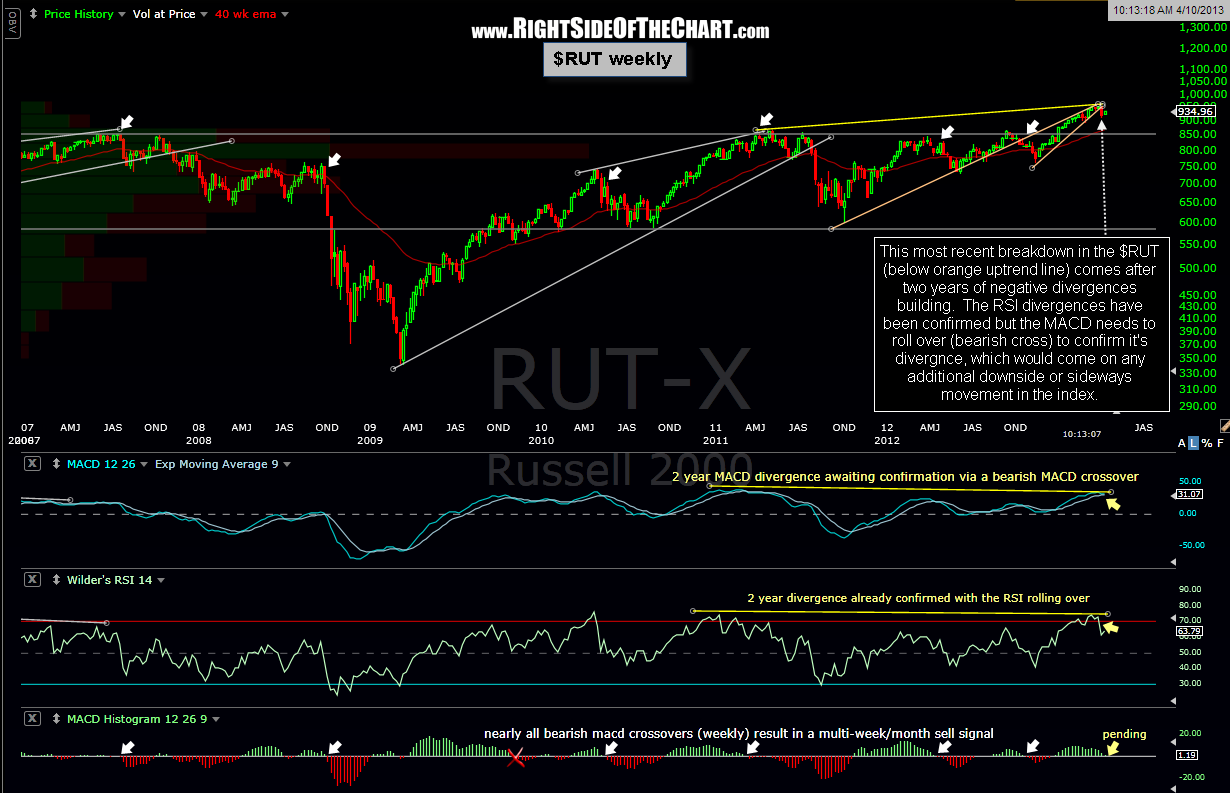
Although IWM has bounced a little further than I had expected over the last few days, nothing has changed my opinion of where the index is likely headed when taking a step back and viewing the bigger picture. As this weekly chart of the $RUT illustrates, the small cap index has recently broken down from a rising wedge pattern after building significant divergences over the last two years. Although it might sound like a minor nuance, there is a significant difference between divergences building and divergences in place. When (negative) divergences are building, it means that the indicator or oscillator being used (e.g.-MACD, RSI, etc..) is lagging behind and remains below it’s previous reaction high as prices go on to make new highs. When incorporating divergences into my analysis, I do not consider a divergence, positive or negative, in place until the indicator being plotted against price has actually made a confirmed lower high (or higher low). For example, on this weekly chart of the $RUT, the RSI has recently turned down and crossed back below the 70 level after essentially peaking at it’s previous high put in two years ago while the $RUT has made a considerably higher high over the same time period. (*note: Negative divergences can also happen when the indicator makes an equal high or low against prices making a higher high or low, this is sometimes referred to as “Flatline Divergence”).
When we look at the MACD on this weekly chart of the $RUT, you will notice that the MACD line (light blue) has turned down and is poised to, but has not yet, crossed below the signal line (white). As bullish and bearish cross-overs are often hard to visually distinguish as these two lines cross, one can use the MACD histogram in order to get a better read on the signal. The MACD histogram, as shown in the bottom pane on this chart, is simply a histogram in which represents the difference between the the blue and white lines. When the histogram changes from positive (green) to negative (red), the MACD line has crossed below the signal line, triggering what is referred to as a bearish crossover. Once we get a bearish MACD crossover, at least in my book, the long building negative divergence on the MACD will be confirmed, i.e.- divergences in place. Until then, those divergences are still just building and could be “negated” if the MACD were to suddenly turn back up and go on to take out the previous reaction high put in around two years ago.
On a final note, as the white arrows on this chart indicate, nearly all bearish MACD crossovers (this chart spans about 6 years) have produced multi-week to multi-month sell signals. In summary, I am waiting to for a bearish MACD crossover on the weekly time frame of the $RUT which, based on the current positioning and momentum of the MACD line, would likely come if the $RUT does not manage to print a solid close higher this week or next. When using weekly chart, it’s best to wait for a weekly (i.e.-end of day Friday) close when using signals such as bearish crossovers, candlesticks patterns, trendlines, etc..