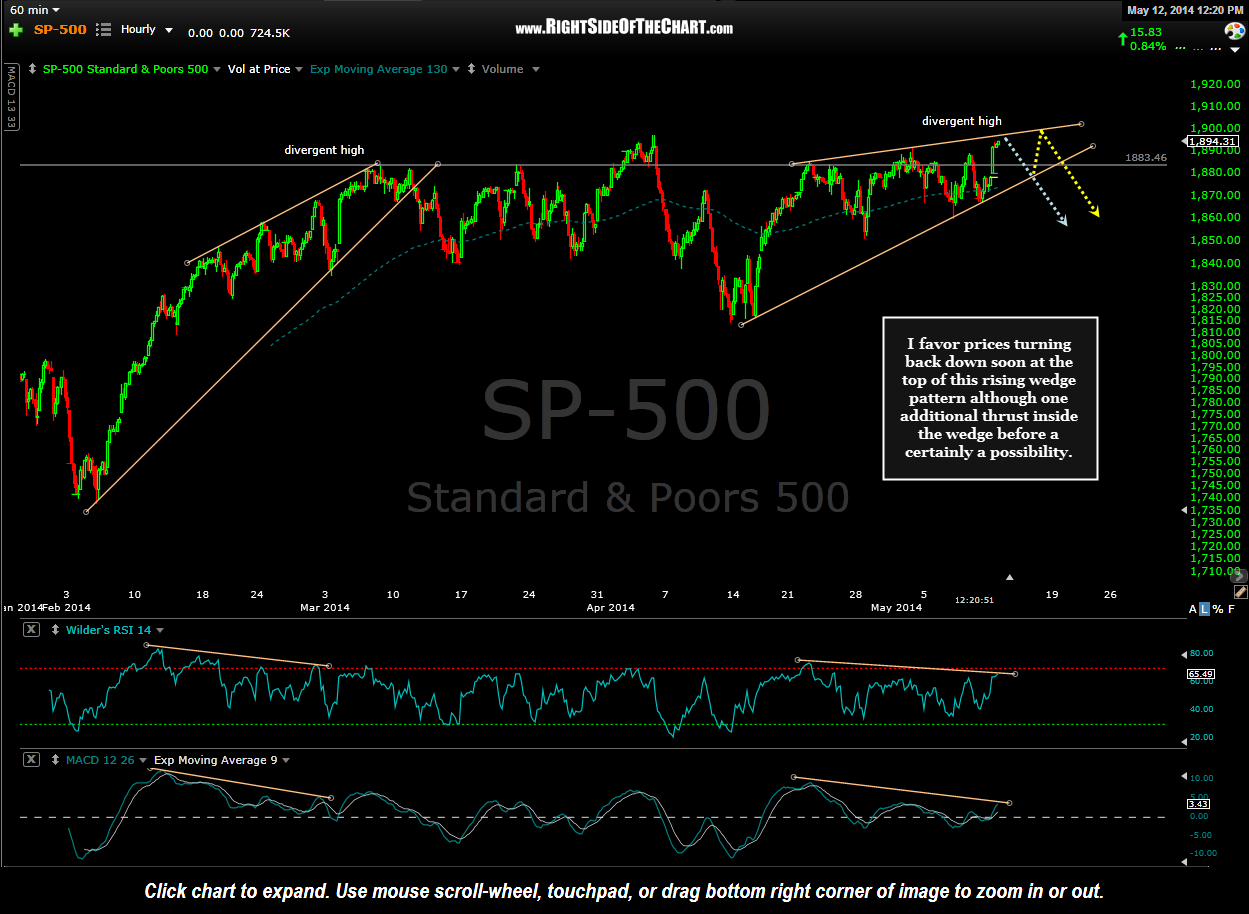
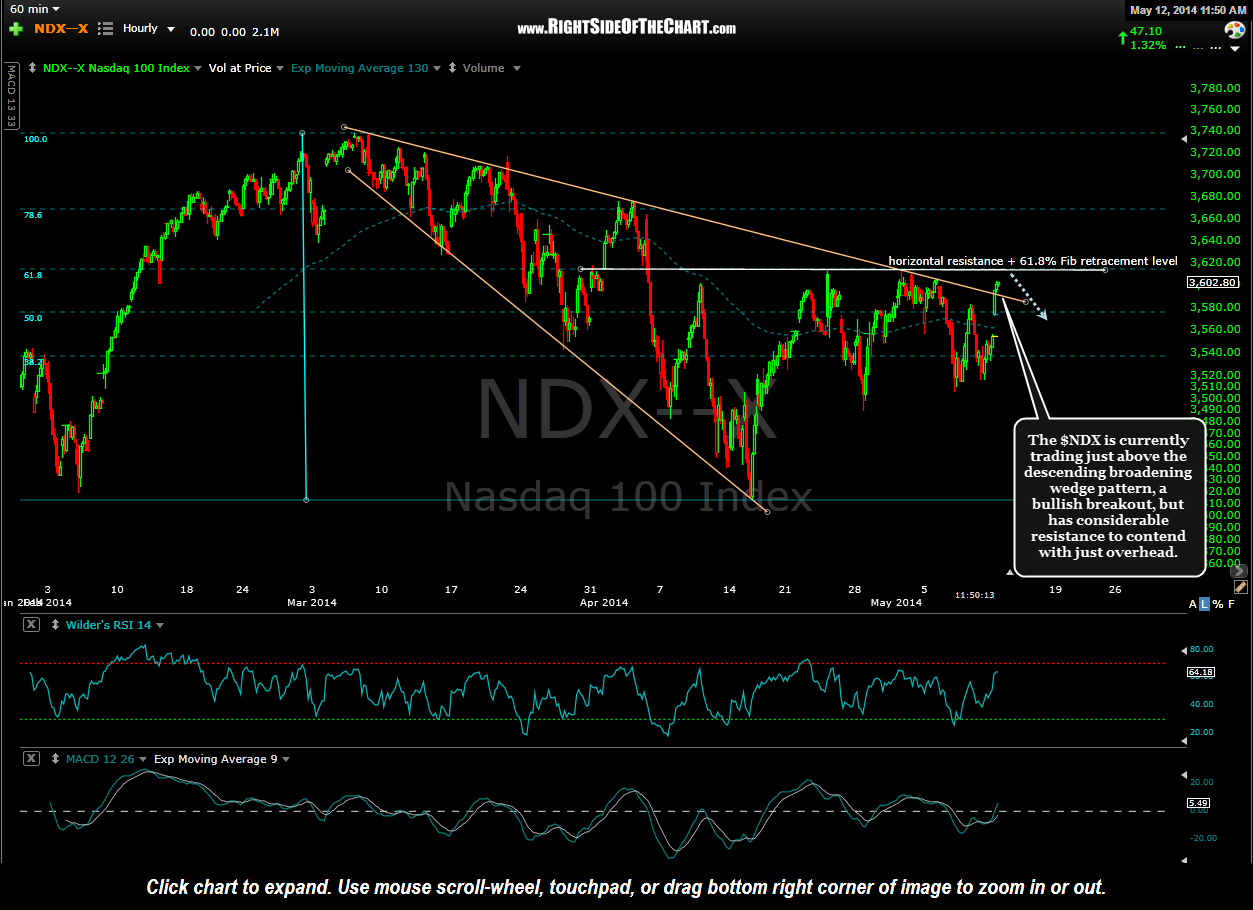
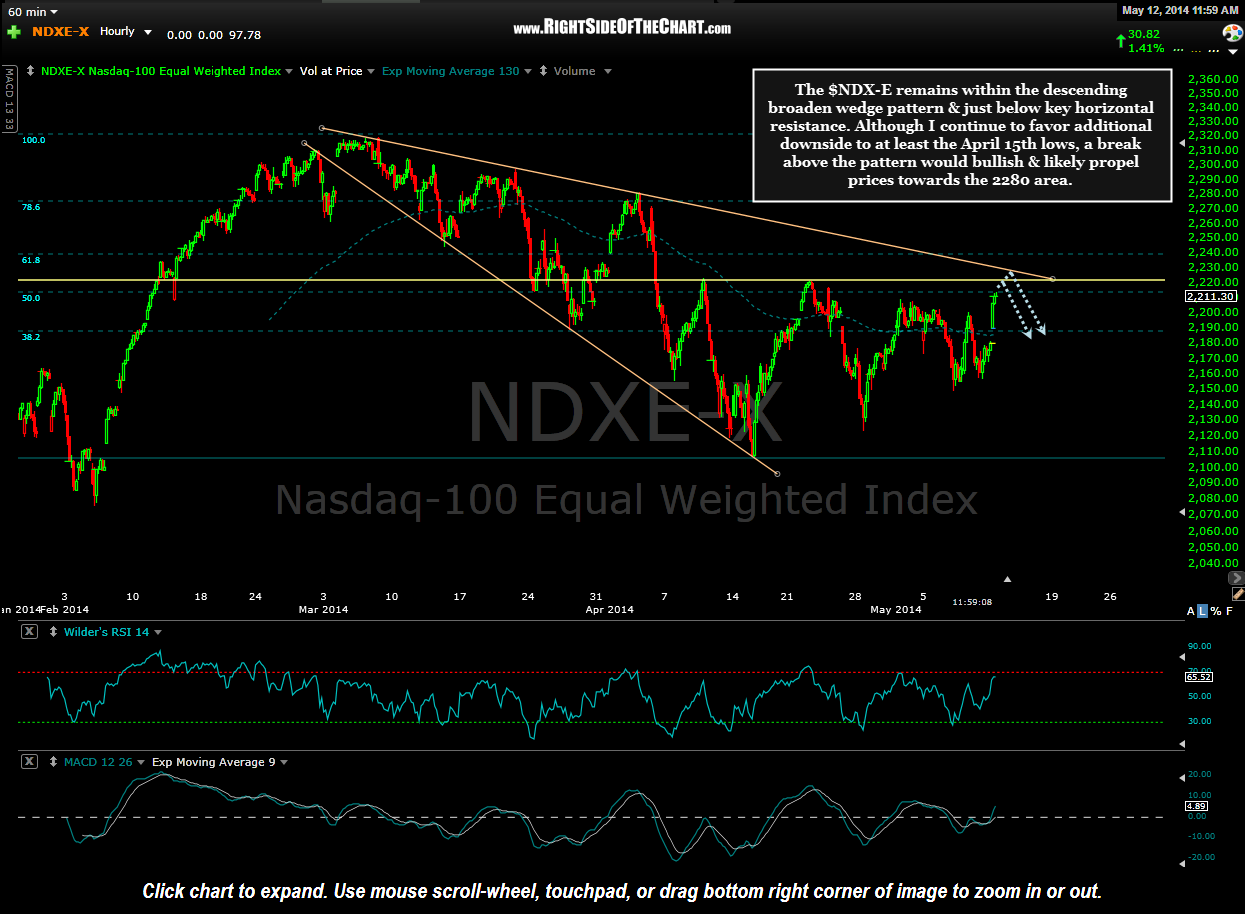
The technical picture continues to remains relatively obscure at this time due to the recent bifurcation between the major US stock indices. So far today, the $NDX (Nasdaq 100 Index) has broken above the descending broadening wedge pattern with the $NDX-E (Nasdaq-100 Equal Weighted Index) still well within its similar pattern & as well as trading just below the 2222 horizontal resistance level. The $SPX (S&P 500 Index), which has been resilient in the face of the recent weakness in the Nasdaq & Russell 2000 small cap index, is threatening a break to new highs although the significant negative divergences in place warn that any breakout to new highs will not be likely to stick.
-

- $NDX 60 minute May 12th
-
- $NDX-E 60 minute May 12th
-
- $SPX 60 minute May 12th