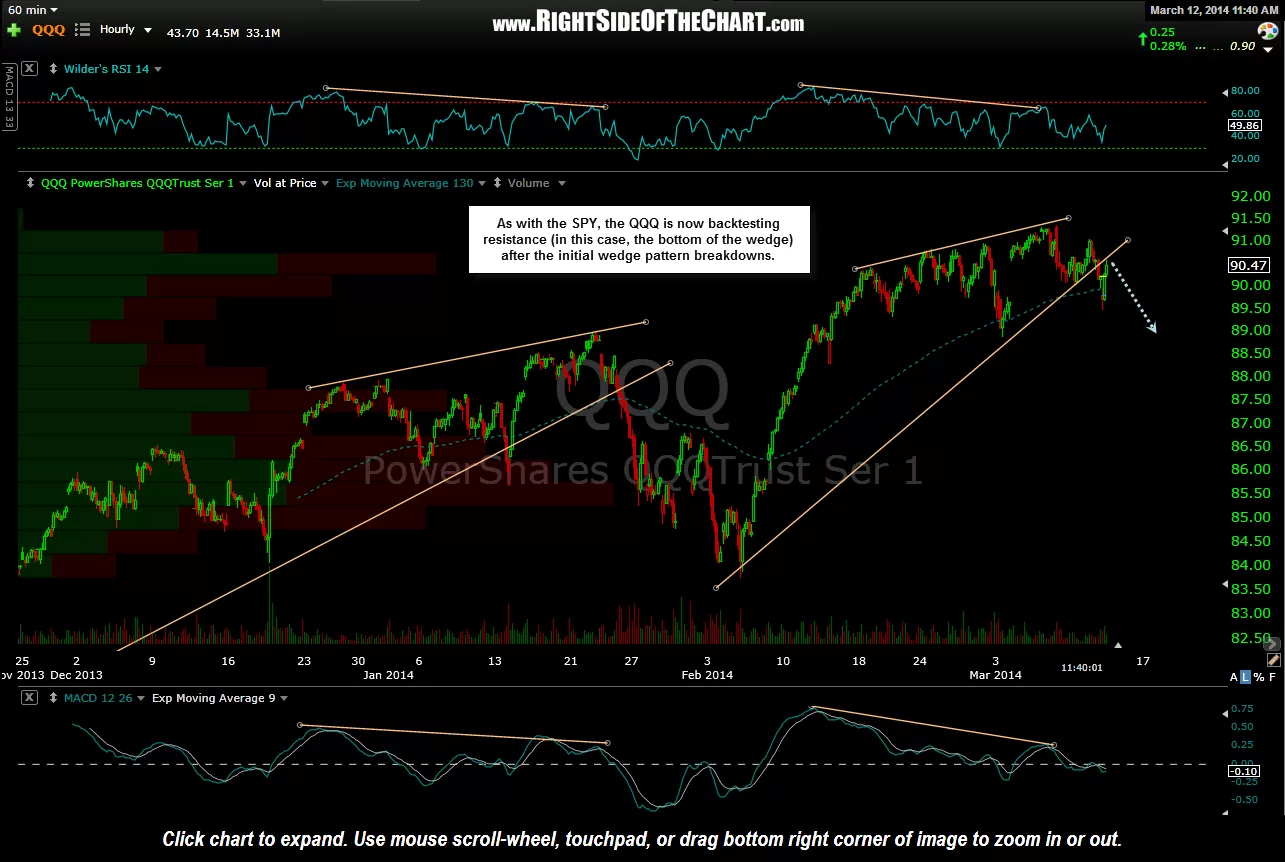
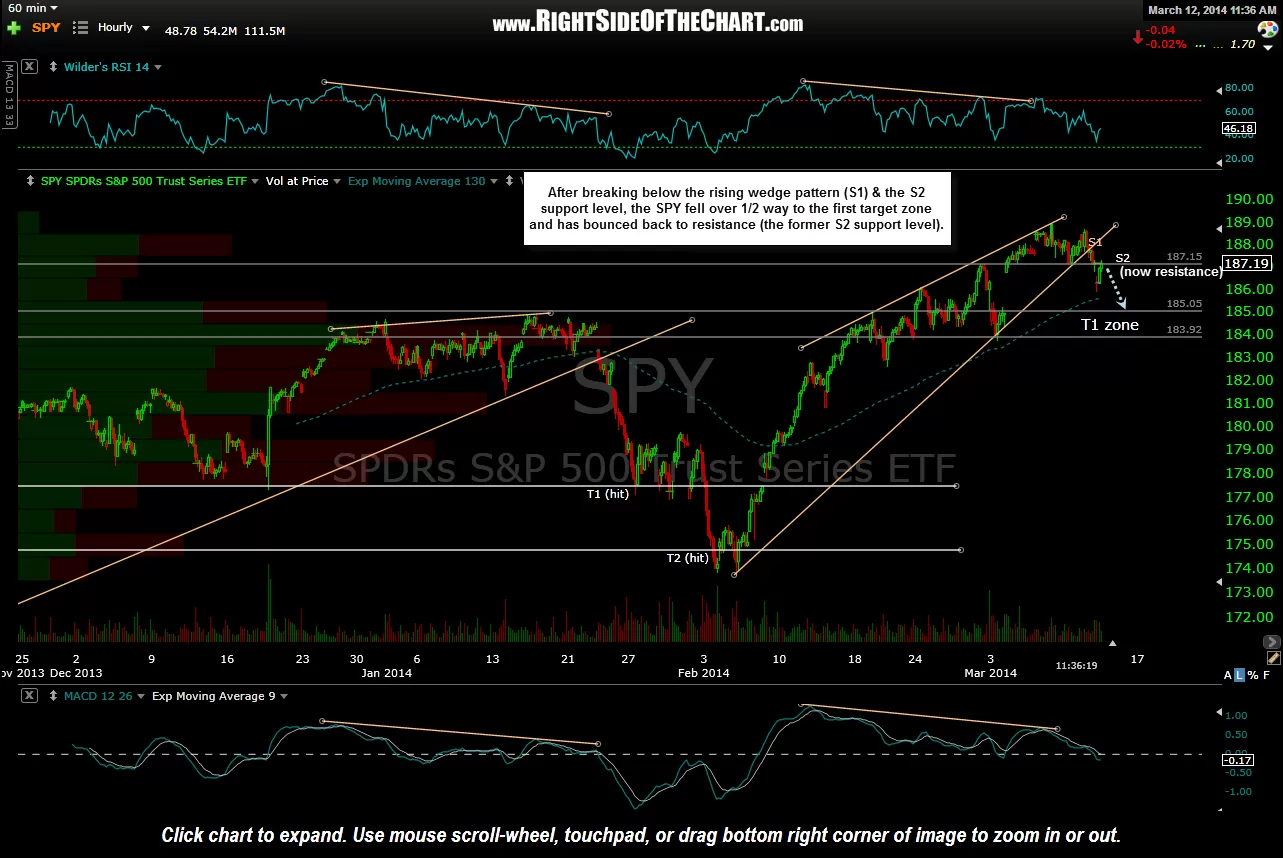
Following the recent breakdowns of the bearish rising wedge patterns on the previously posted 60 minute charts of the SPY & QQQ, both key US indices are now backtesting resistance levels from below. As shown on the updated SPY 60 minute chart below, after falling just over 1/2 way to the top of the first target zone, prices reversed and are now challenging the former S2 support level. Once a support level is broken it becomes resistance. In the case of the Q’s, prices are now backtesting the bottom of the recently broken bearish rising wedge pattern from below. As such, this looks like an objective short entry on both or either of these broad index tracking ETFs, with the appropriate stops in place above. Additional downside targets to be added soon. Updated 60 minute charts below:
-
- SPY 60 minute March 12th
-
- QQQ 60 minute March 12th