
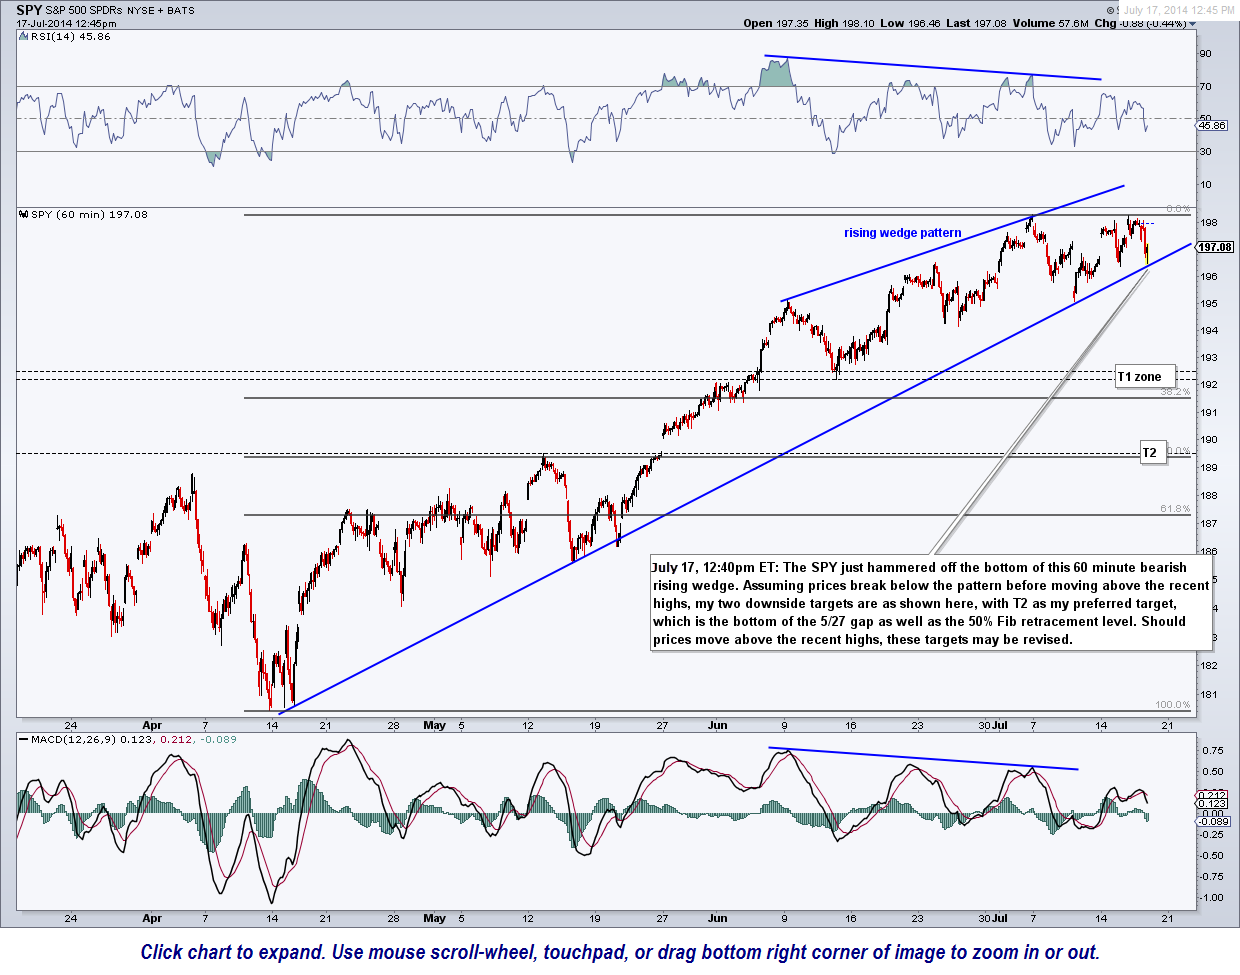
SPY 60 minute July 17th
The SPY just hammered off the bottom of this 60 minute bearish rising wedge pattern. Assuming that prices break below the pattern before moving above the recent highs, my two downside targets are as shown here. If so, T2 is my preferred target, which is the bottom of the 5/27 gap as well as the 50% Fib retracement level. Should prices move above the recent highs, these targets may be revised.
As far as the recent short trade ideas, one should always keep one eye on the broad markets when timing entries & exits on your positions. Support is support until broken and as I pointed out in the previous email, the SPY had just fallen to the bottom of the rising wedge pattern, where at least a minor reaction (bounce or consolidation) was likely. So far, the SPY has hammered off the bottom of the wedge & with prices still in close proximity to that uptrend line, i.e. – support, it would be prudent to wait for prices to either break below the wedge or bounce back to a decent resistance level before adding any new short exposure.
For subscribers of stockcharts.com, the live, annotated version of this chart can be viewed by clicking here. Those who do not subscribe to stockcharts.com are not able to view intraday charts, such as this 60 minute chart, only daily & weekly charts. I am considering adding intraday charts of some of the major index tracking ETFs to the Live Charts section so drop me a line if you would be interested in having access to intraday charts on via the Live Charts section.