
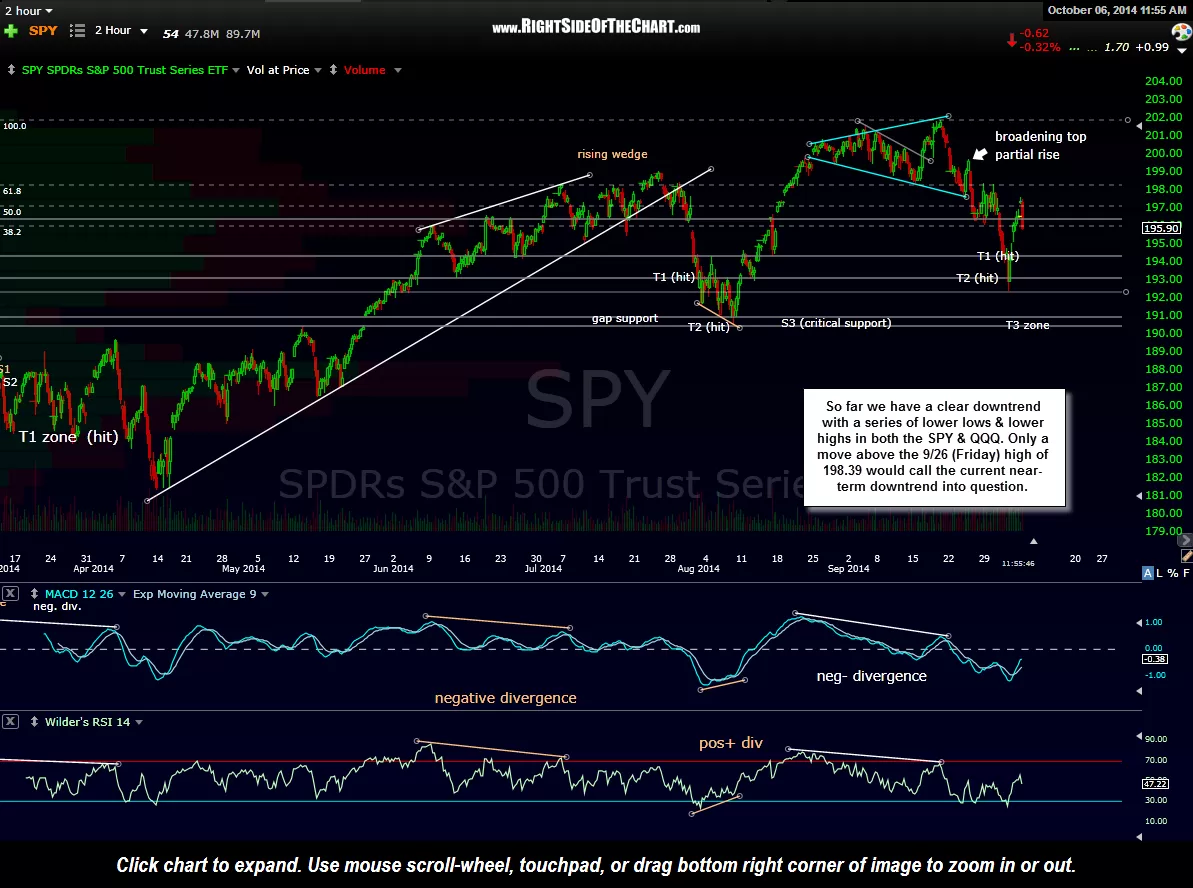
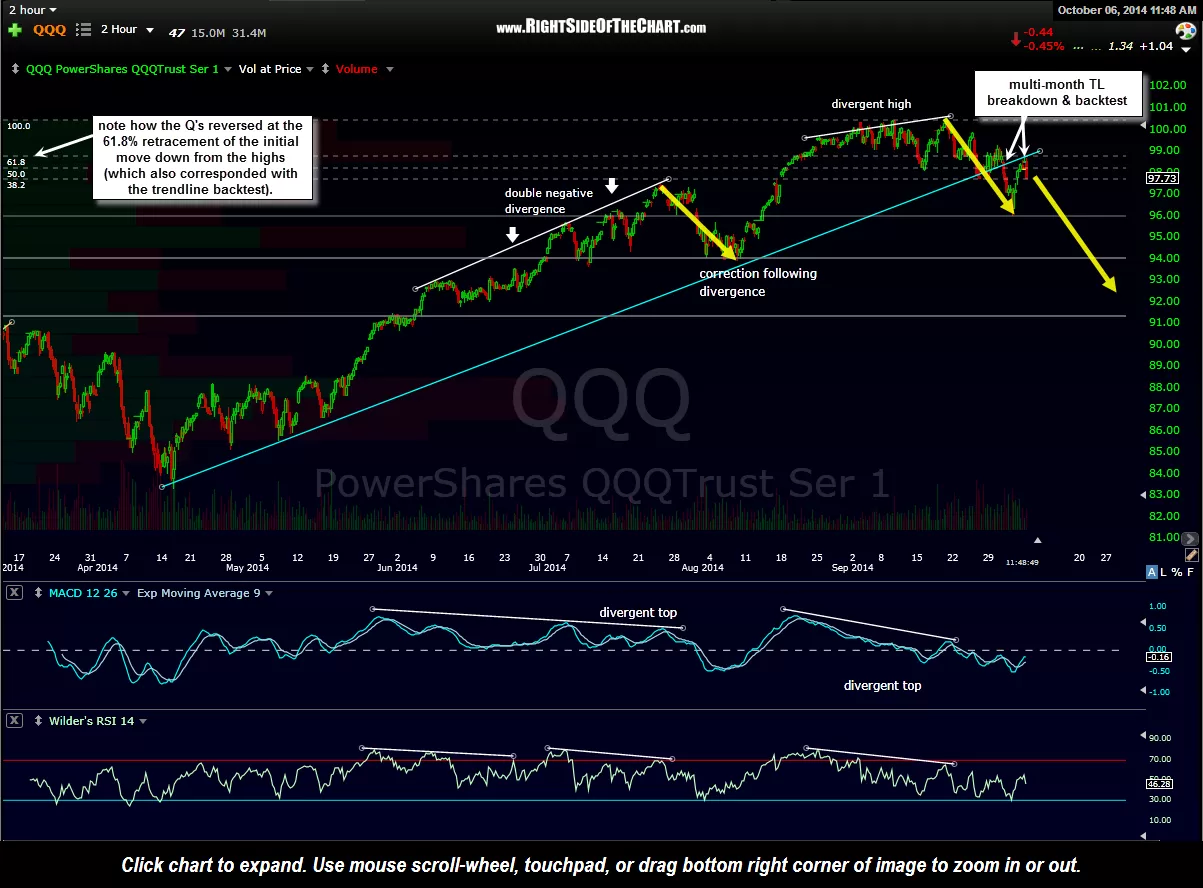
Although the SPY (S&P 500 Index tracking etf) bounce slightly exceeded the two previously posted bounce targets, moving about 1.75% above the former T1 level & less than 3/4% above the “next resistance level”, that bounce, assuming that it is complete, was well within the normal range of a counter-trend bounce as the SPY stopped well shy of the 61.8% Fibonacci retracement level. The reversal in the QQQ (Nasdaq 100 Index tracking etf), so far, occurred on the backtest of the previously highlighted multi-month uptrend line which also corresponded with the 61.8% Fibonacci retracement of the move from the Sept 19th high to the Oct 2nd low. Although it is certainly too early to say with a high degree of confidence that the bounce off of last Thursday’s lows is complete, the impulsive selling that we’ve seen so far today following the rejection of the Q’s off that downtrend certainly looks bearish. So far we have a clear downtrend with a series of lower lows & lower highs in both the SPY & QQQ. Only a move above the 9/26 (Friday) high of 198.39 would call the current near-term downtrend into question.
-

- SPY 120 minute Oct 6th
-
- QQQ 120 minute Oct 6th
Remember, the most important level to watch right now for a longer-term sell signal is the primary bull market uptrend line on the $SPX & $OEX weekly charts. The $OEX weekly can be found under the Live Charts page & I plan to add a link to the $SPX weekly (which almost mirrors the $OEX) asap. A solid weekly close above those bull market uptrend lines will likely signal the start of a much deeper correction & possibly a new bear market. (*Corrections are typically defined as a drop of 10% or more while a bear market is typically considered a drop of 20% or more). Until then, keep in mind that the broad market is currently trading on that major uptrend support line. Should these bearish patterns on the intraday charts of the Q’s & SPY play out, that will likely bring prices below the weekly uptrend lines, thereby triggering at least intermediate term sell signal. It is also worth noting that all of my short-term trend indicators are currently bearish (on sell signals) while I’m closely watching for a bearish crossover of the 20/50 day EMA pair on the $SPX/SPY for an intermediate-term sell signal. Based on the current posture of that MA pair, a sell signal (death cross of the 200/50 EMA pair) should occur if/when my third near-term target (T3 on the recent 60 & 120 minute SPY charts) is hit.