
I’ve been monitoring the solar sector in recent weeks as there are quite a few stocks that appears to be setting up for what could be potentially explosive rallies following a vicious bear market in many of these stocks. Early this morning in the trading room, I mentioned a couple of solar stocks that I’ve taken starter positions today including YGE & FSLR. Although these are not official trade ideas at this time, several of the solar stocks are under consideration for long side Swing Trade ideas as well as potential Long-term Trade ideas.
Official trade ideas, particularly the longs, have been light recently due to both market conditions (we just finished the least volatile quarter the stock market in over half a century and low volatility = a sharp decrease in swing trading opportunities) as well as the near-term bearish trend & outlook for the broad markets. As such, I figured that I’d share some of my favorite trade setups in the solar sector, some of which, such as YGE & FSLR, appear to offer objective long entries at this time with the objective buy triggers & potential price targets on the others listed in the notes below.
SPWR (SunPower Corp) appears to be setting up in a large bullish falling wedge pattern, complete with positive divergences that should be confirmed soon if prices begin to rise from here. Aggressive traders could take a full or partial position here at the bottom of the wedge while the more conventional, higher probability entry or add-on will come on an impulsive breakout above the falling wedge pattern. Horizontal lines mark potential price targets.
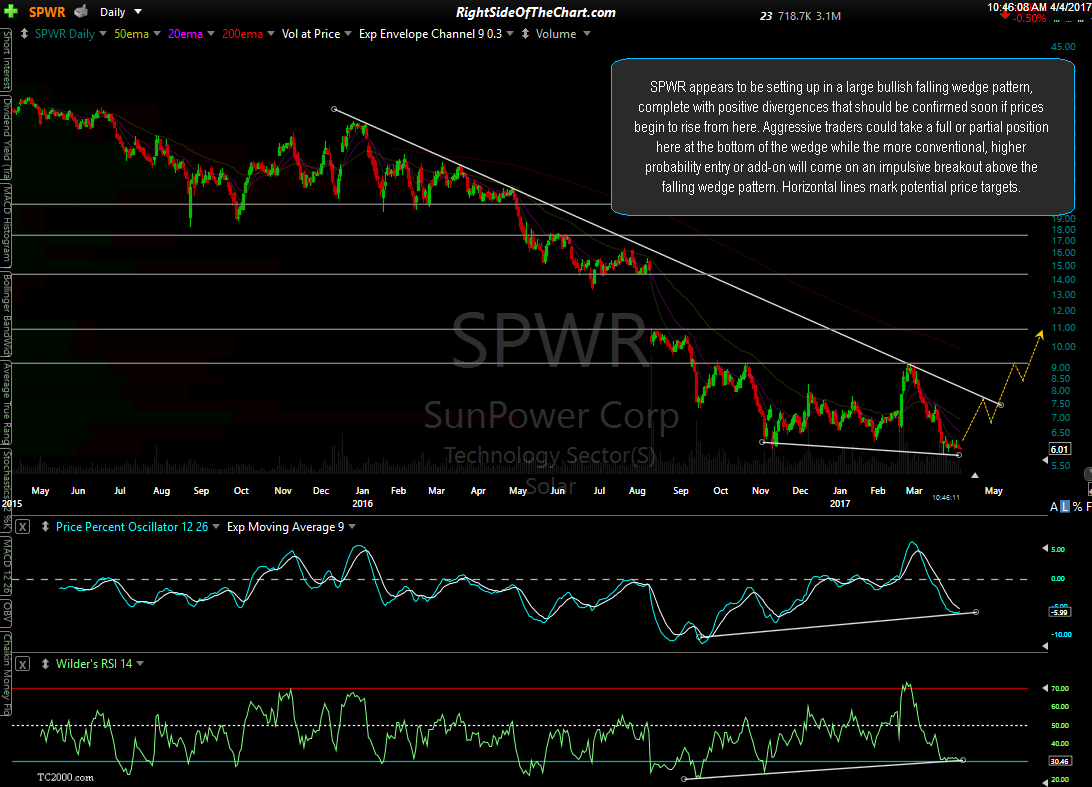
SPWR daily April 4th
A very low prices (2/10ths of 1 cent) very high risk/high potential return setup for aggressive traders. ASTI (Ascent Solar Technologies) looks poised to rally up to any or all of these horizontal resistance levels on an impulsive break above this bullish falling wedge pattern, confirmed with potential positive divergences that appear to be forming.
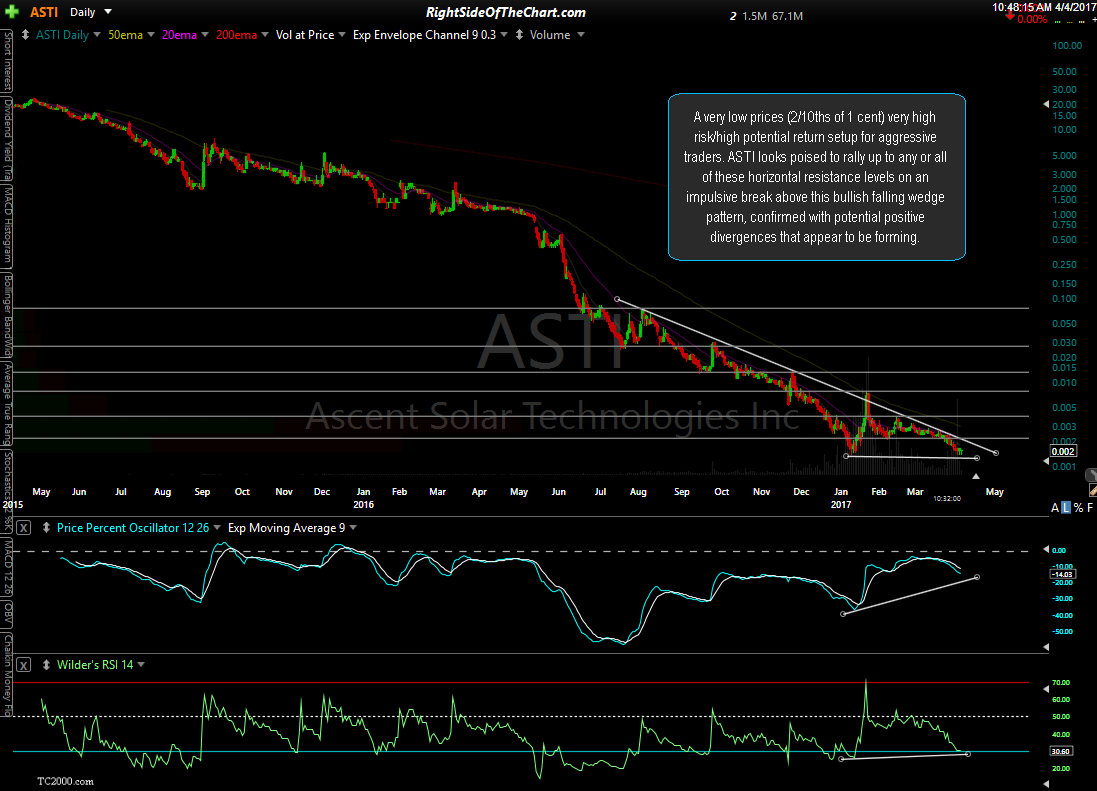
ASTI daily April 4th
Another low-price, potentially high-risk/high-return trade setup, RGSE (Real Goods Solar Inc) looks poised to run up to any or all of these horizontal resistance levels (3.65,5.80 & 10.65) on an impulsive break above this bullish falling wedge pattern which is confirm with positive divergences.
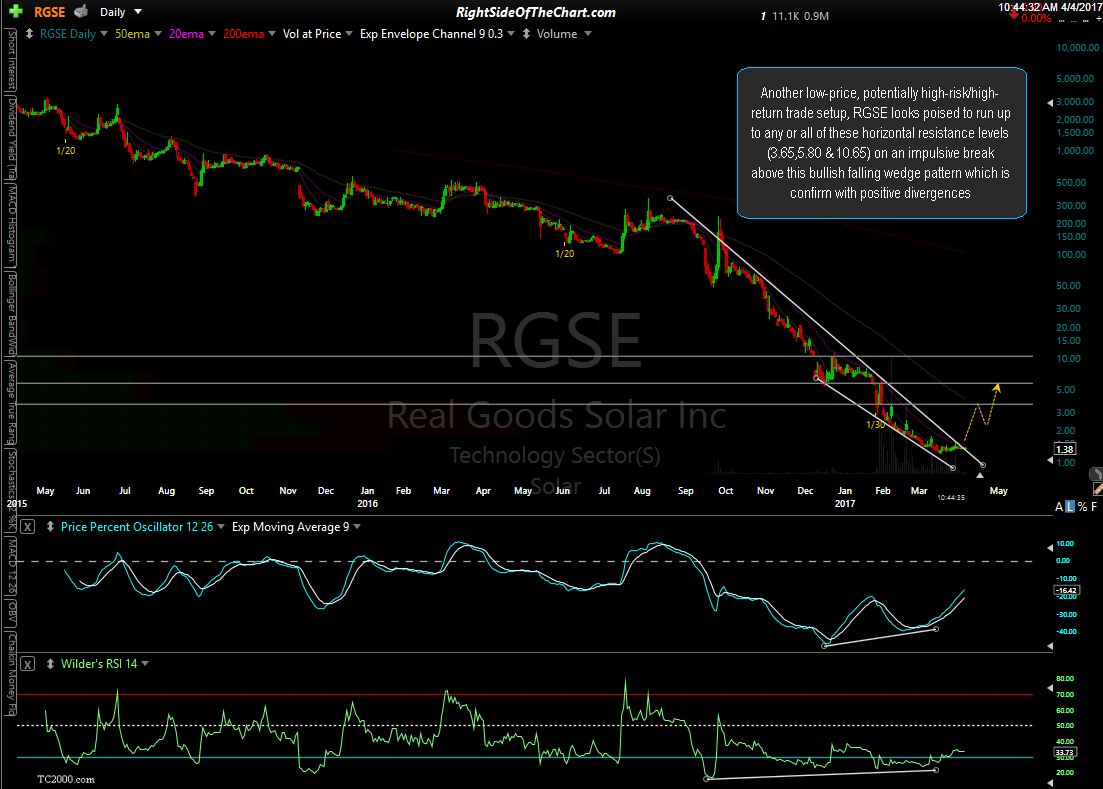
RGSE daily April 4th
SEDG (SolarEdge Technologies) was posted as a Long Swing Trade back on Sept 28th just a bit early & with a very tight stop that was hit for a small loss of just 1.66%. The stock went on to back-test this bullish falling wedge before going on to hit the first target & still appears likely to hit the remaining two targets in the coming months.
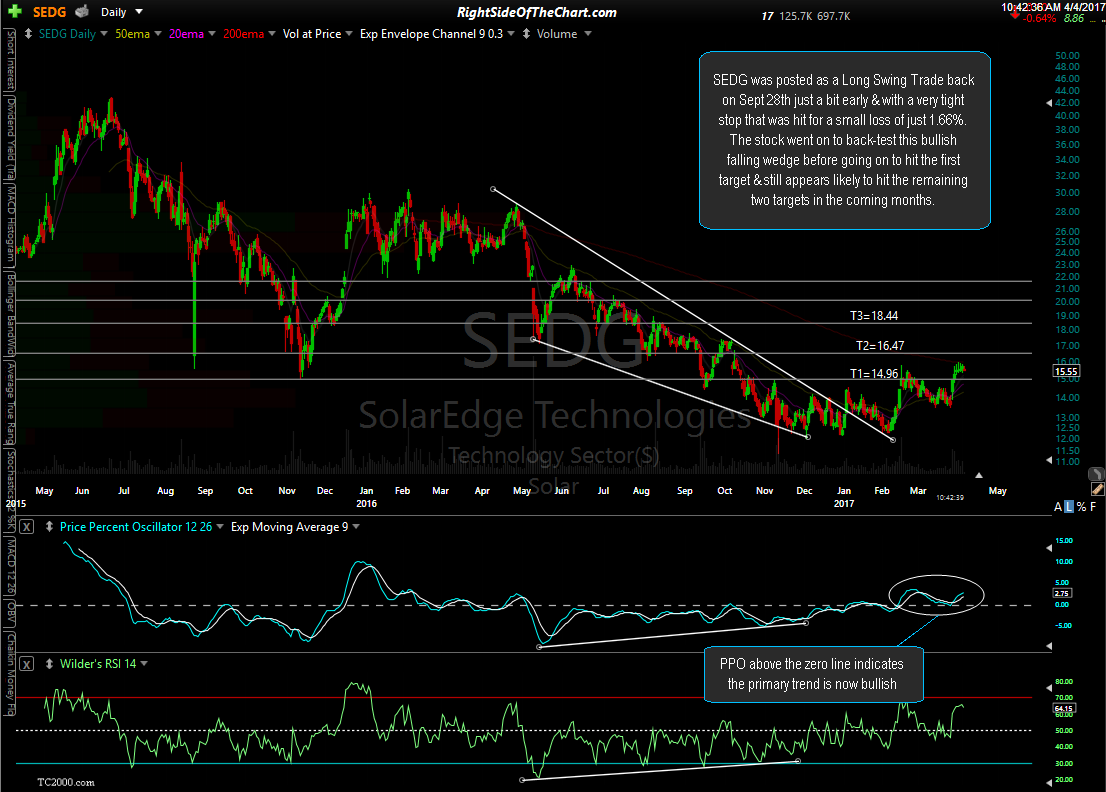
SEDG daily April 4th
CSIQ (Canadian Solar Inc) recently back-tested this large bullish falling wedge pattern, which was confirmed with positive divergences at the November lows & appears likely to be headed to at least the 16 area in the coming months.
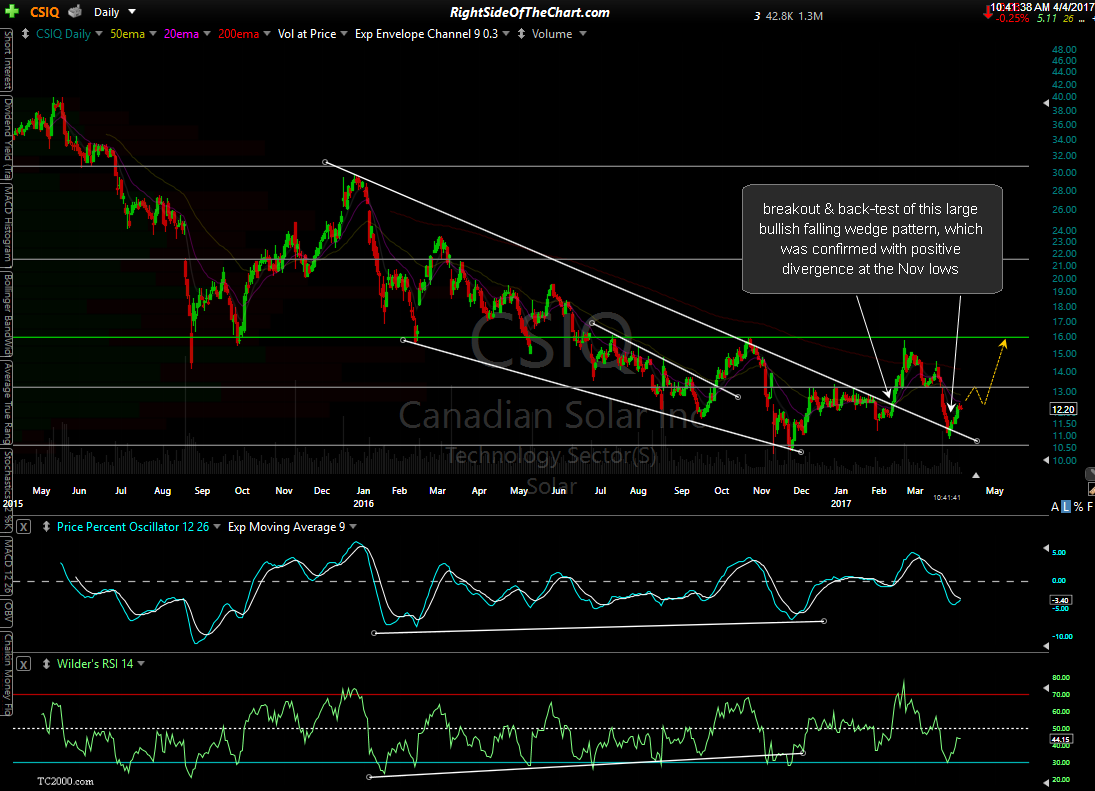
CSIQ daily April 4th
HQCL (Hanwha Q CELLS Co Ltd) just put in a divergent low within this bull falling wedge pattern. Next buy signal to come on a break back above the 7.75ish level which was a very critical support level that was recently taken out. Should HQCL manage to regain this level soon, especially with a breakout above the downtrend line, that would be extremely bullish as this recent breakdown will have proved to be a bear-trap. Minimum price target 9.80 which is 35% above current levels.

HQCL daily April 4th
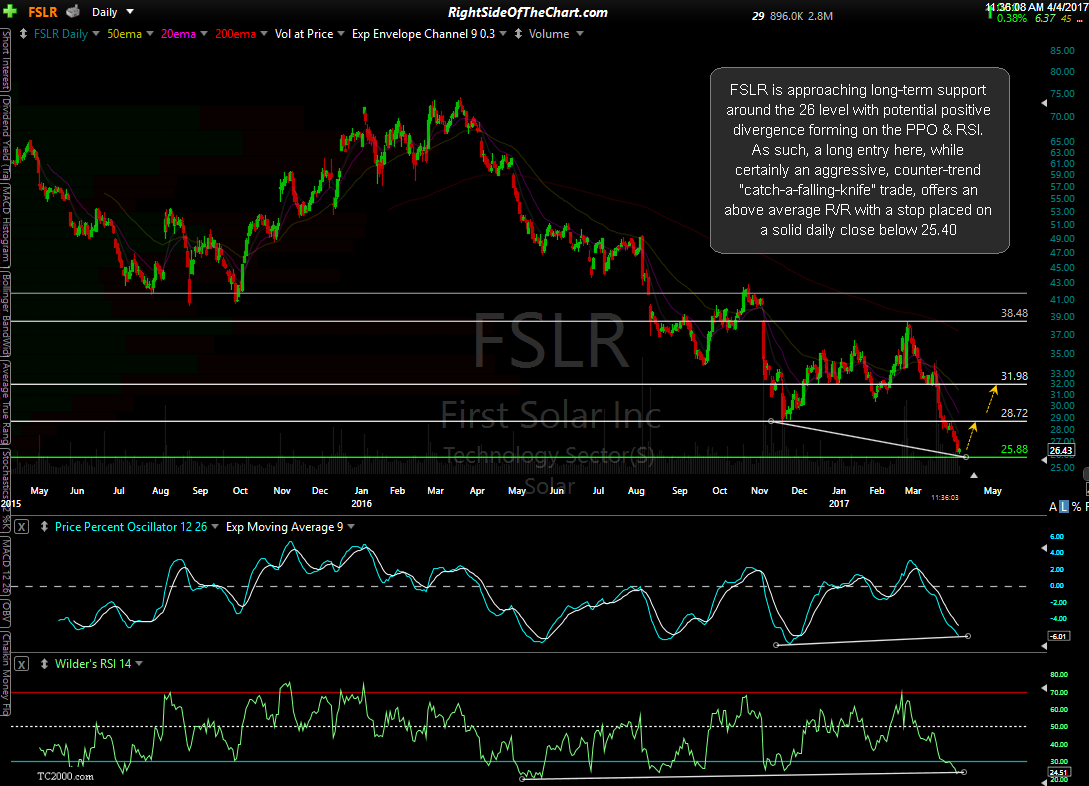
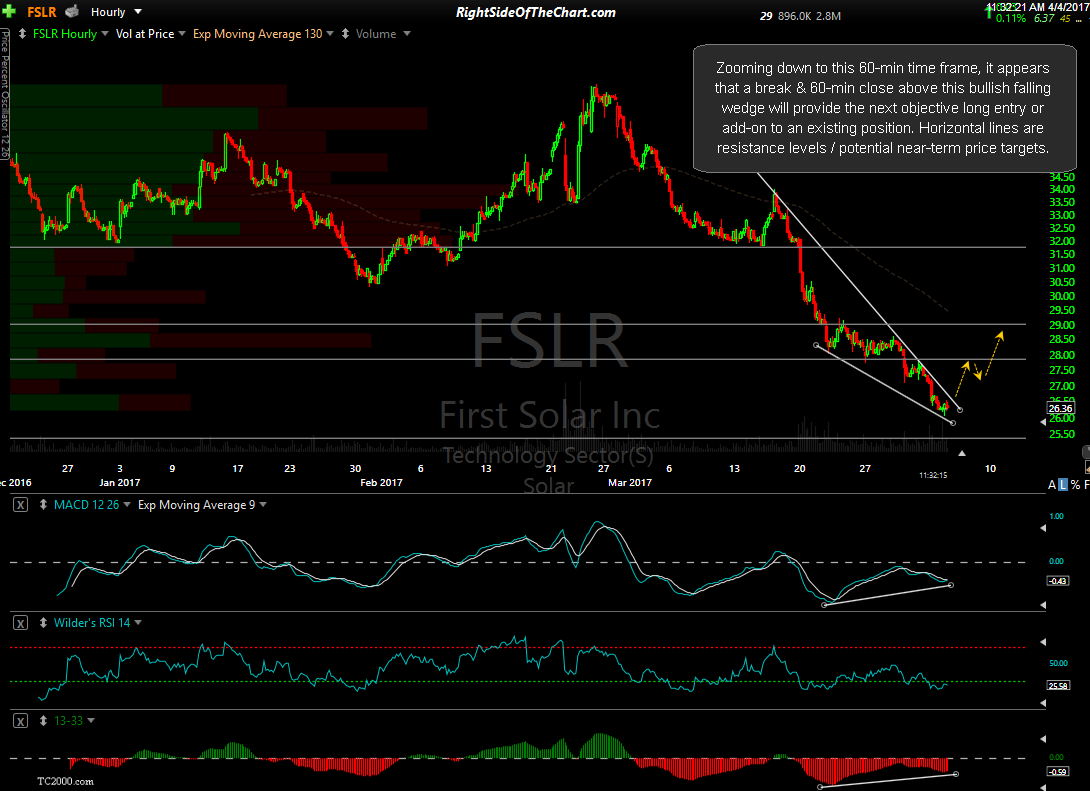
FSLR (First Solar) is approaching long-term support around the 26 level with potential positive divergence forming on the PPO & RSI. As such, a long entry here, while certainly an aggressive, counter-trend “catch-a-falling-knife” trade, offers an above average R/R with a stop placed on a solid daily close below 25.40. Zooming down to this 60-min time frame, it appears that a break & 60-min close above this bullish falling wedge will provide the next objective long entry or add-on to an existing position. Horizontal lines are resistance levels / potential near-term price targets.
-

- FSLR daily April 4th
-

- FSLR 60-min April 4th
YGE (Yingli Green Energy Holding Co.) broke out above both the yellow downtrend line as well as the 2.90 resistance level today & currently offers an objective entry here on this pullback to re-test the 2.90 former resistance, now support level. Price targets would be set just below the resistance levels in green. Should YGE fall back below 2.90, a back-test of the downtrend line would offer the next objective entry or add-on.
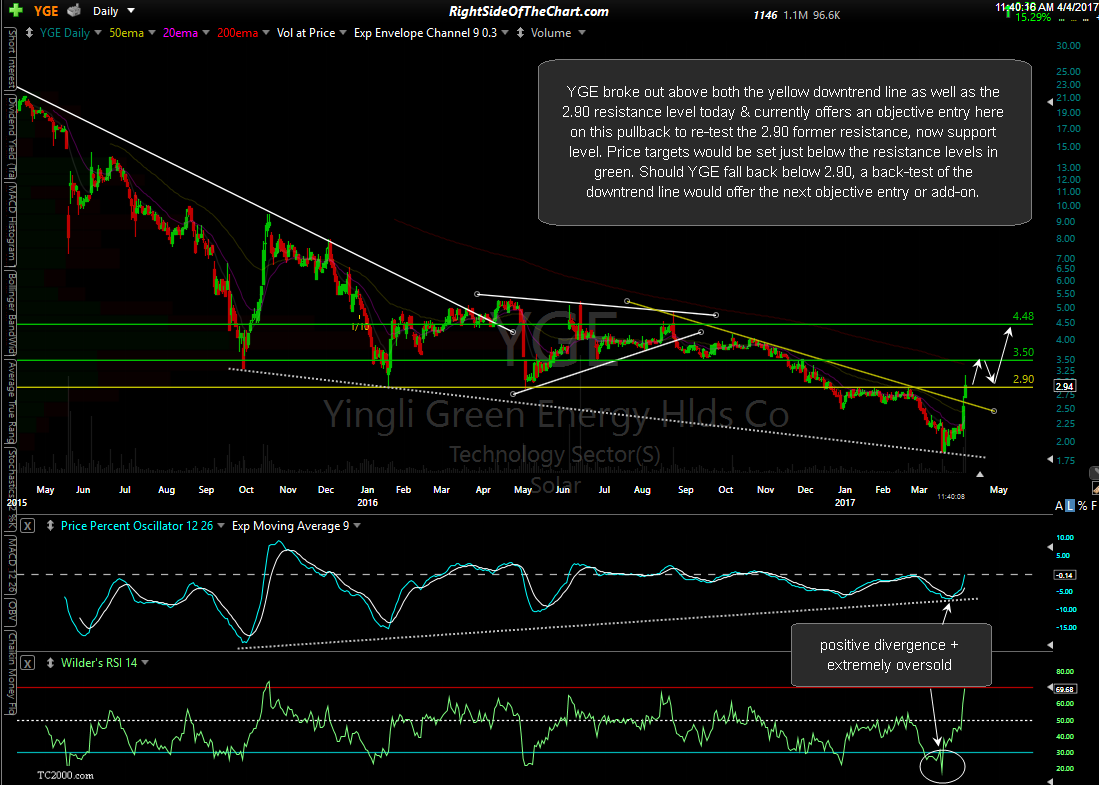
YGE daily April 4th