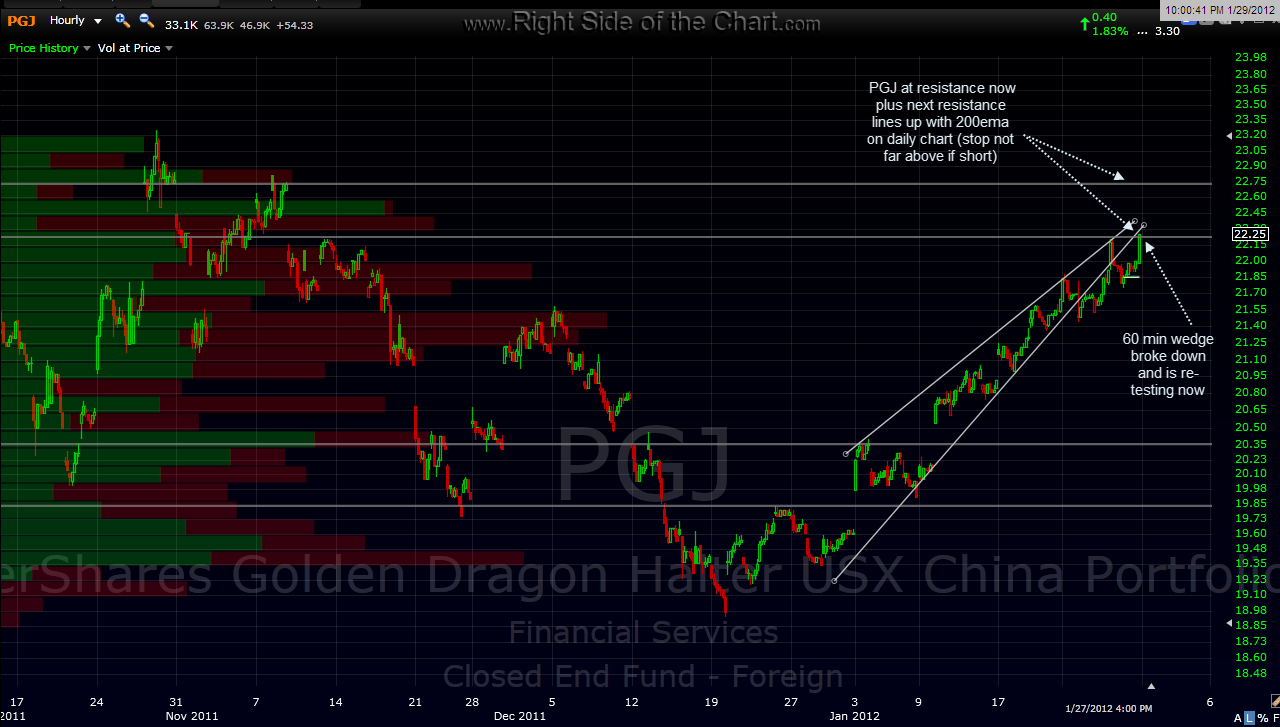
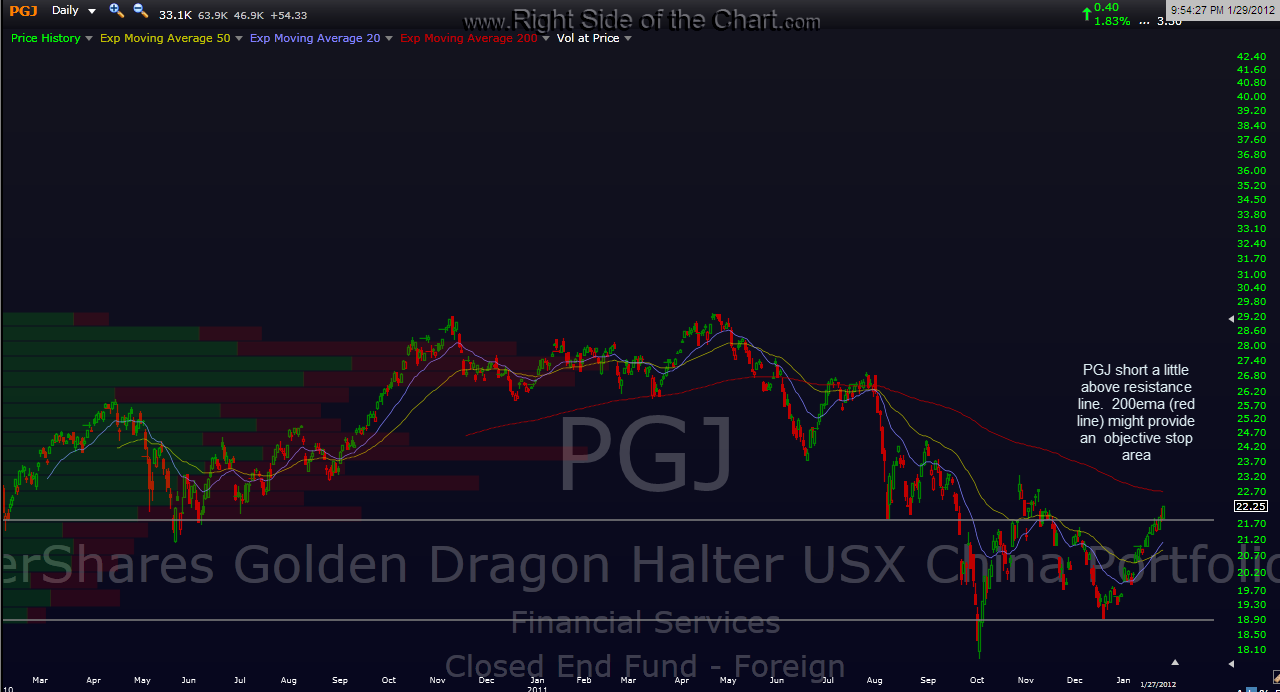
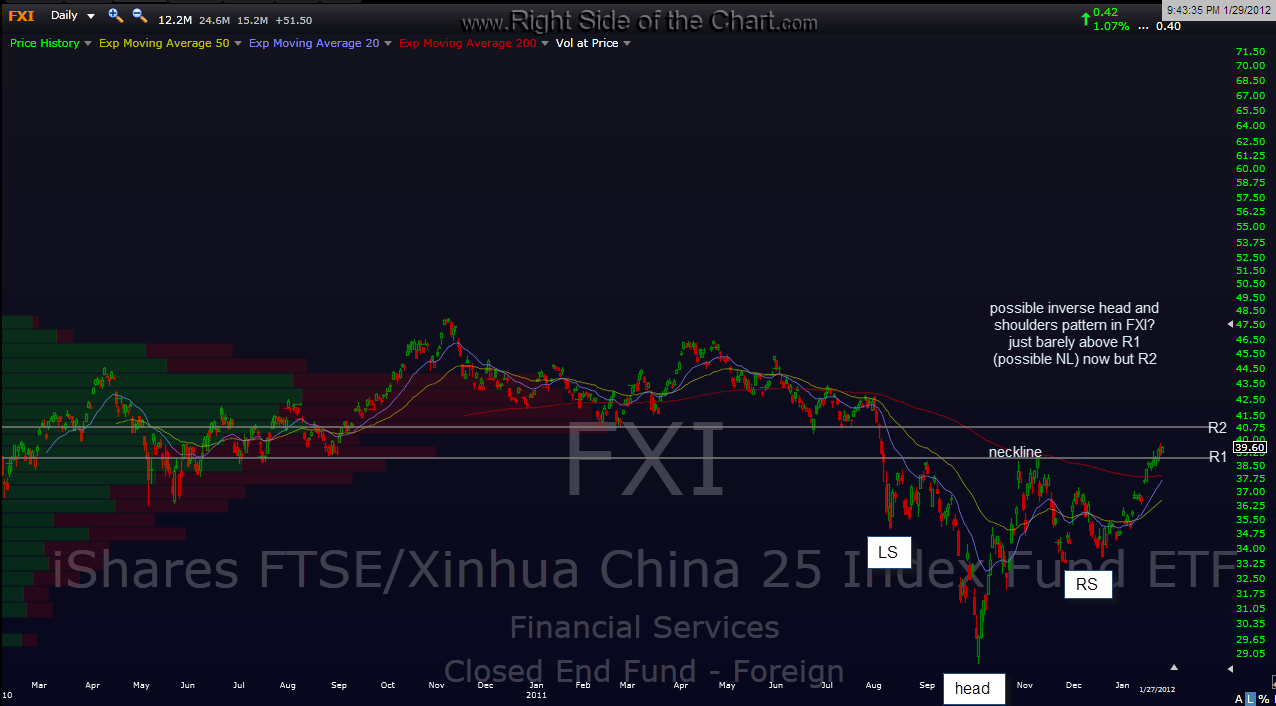
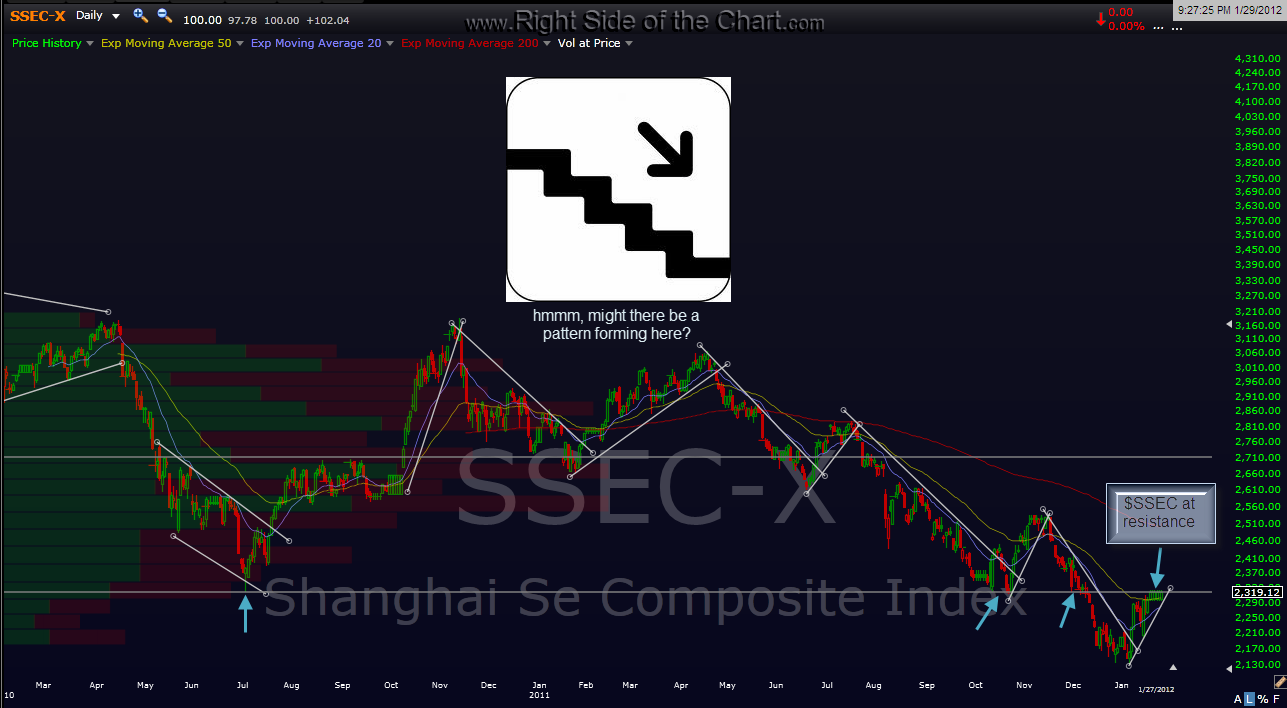
PGJ short set-up posted on tuesday broke down below the rising wedge pattern on the 60 min chart shortly after and is now re-testing the lower trendline while also at a decent horizontal support level. see notes on the updated daily and 60 min charts below for an objective stop area on the trade if you took it or plan to enter this week. although i still think PGJ is an objective short here, i will point out that i see a possible inverse head and shoulders pattern in the related FXI etf that, if valid, has completed formation and sits right on the neckline, close to a possible trigger. (IHS are bottoming patterns so an upside break would be bullish). i’ve also included the $SSEC daily chart as well, as i give preference to the $SSEC index over the various etf’s which track various baskets of chinese stocks.

Results for {phrase} ({results_count} of {results_count_total})
Displaying {results_count} results of {results_count_total}