
Member @dazi requested an update on NVDA. Last week, in this post (NVDA Setting Up for a Potential Trend Reversal), the case for a top & significant trend reversal in NVIDIA was made. Here’s a quick review of the longer-term outlook as well as some of the recent developments on the intraday (60-minute) time frame:
10-year weekly chart: NVDA is at overbought extremes in both scope (recently above 88 on the RSI) as well as duration (RSI above 70 for nearly 8 months). If the historical returns following the previous overbought readings that were much less severe are any indication, NVDA is poised for one heck of a correction in the coming months+. A break of this steep uptrend line will provide an objective add-on to an existing or new short position. (note: all charts will expand if clicked on & can be further zoomed & panned using a mouse scroll-wheel, touch-pad or dragging the lower right-hand corner of the chart once expanded).

NVDA weekly Jan 5th
2-year daily chart: Following the recent divergent high & channel overthrow + bearish engulfing candlestick at the highs (a reversal / topping pattern), NVDA has moved impulsively back into the channel & is likely to continue down to any or all of the levels marked on this daily chart.
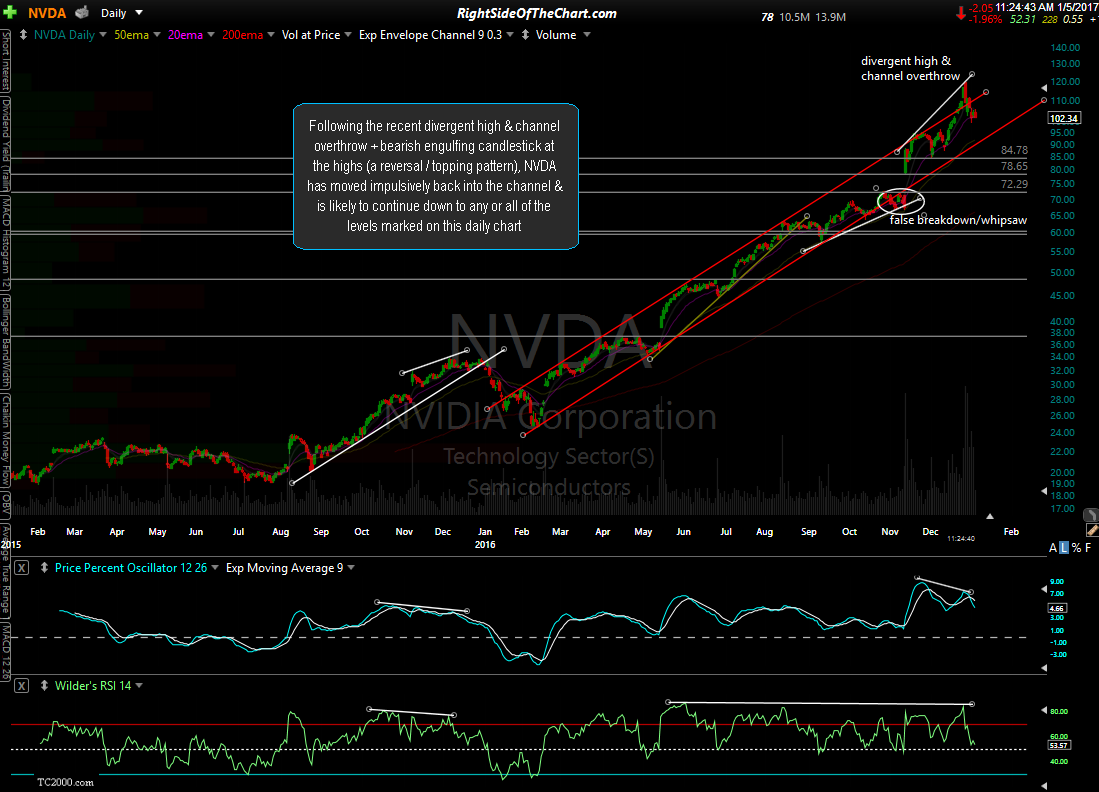
NVDA daily Jan 5th
60-minute chart: Following the recent breakdown of this larger rising wedge/contracting price channel, NVDA appears to have formed a bear flag continuation pattern in which it appears to have just broken below, thereby triggering an objective short entry. As such, NVDA will be added as an Active Short Trade with the current price targets as 95.26 (T1) and 87.80 (T2) with the possibility of a third target added around the 73 area, depending on how the charts develop. The suggested stop is any move above 110.00 with a suggested beta-adjustment of 0.80.

NVDA 60-minute Jan 5th