
Members @j1persi & @Ruben inquired about the run-away semiconductor stock, NVDA within the trading room. Although there is some work to be done in order to firm up the case for a trend reversal & swing short trade, here are my thoughts on the stock.
Starting with the big picture via this 10-year weekly chart, we can see that NVDA has been walking up a very steep uptrend line with the stock now trading at valuation levels rarely if ever seen (as per the trailing PE ratio) with the stock also trading at the most overbought levels in at least a decade & quite possibly ever. All previous weekly overbought levels in this stock over the last decade+ were followed by corrections/bear markets ranging from 27%-85% so to say that the risk/reward over the next several months+ is most likely skewed to the downside would be a gross understatement IMO.

NVDA weekly Dec 28th
Stepping down to the daily time frame, I’m on watch for a potential bearish engulfing candlestick on NVDA in conjunction with this channel overthrown, particularly a sharp move back down into & below the channel in the coming days/weeks. Also note the negative divergence forming on both the PPO & the RSI.
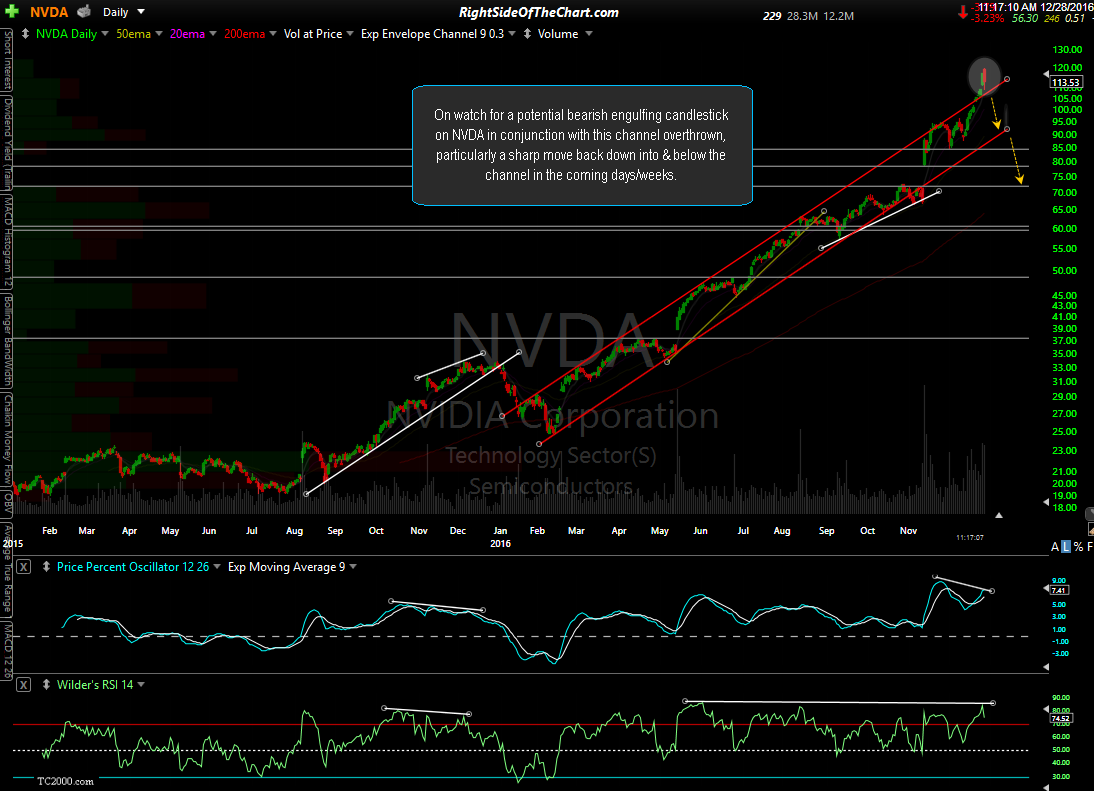
NVDA daily Dec 28th
Now zooming down to the 60-minute time frame which might help more accurately time any exits on existing long positions or entries on a short position, it appears that NVIDIA is at the top of a rising wedge/contracting price channel while also sitting on a minor uptrend line within the larger pattern. As with the daily time frame, the most recent high was a divergent high. Downside price targets/support levels would be the uptrend line as well as any or all of these horizontal support lines.
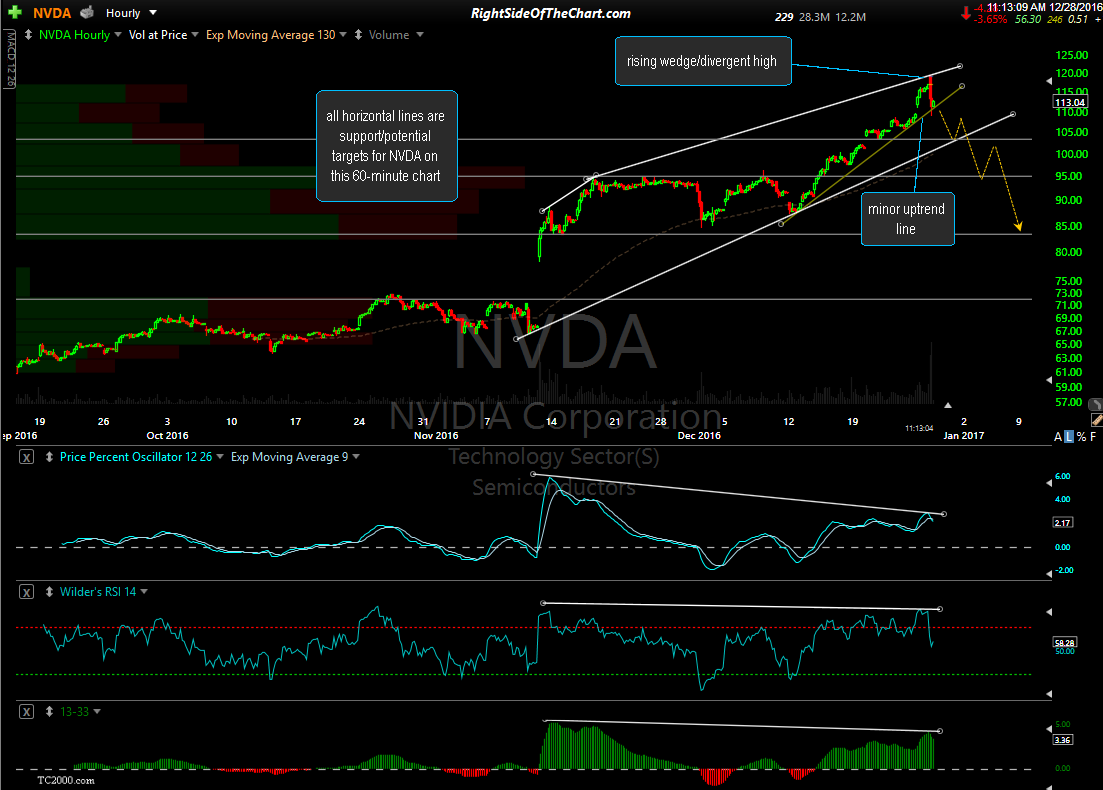
NVDA 60-minute Dec 28th