although i’ve been trying to find the time to update the performance of the trade ideas posted here, which hopefully i’ll be able to get caught up on soon, i just wanted to share how i report the results. first of all, i do not trade or manage the trades ideas on this site for show. i trade for my own personal profits and although i do not take all, or even most of the trade ideas posted here (mainly because it would be too many positions to personally manage at one time), i do my best to try not to manage this site as to give the appearance that all or most of the trade ideas posted here are winners and very few, if any, are losers, as that is not the case.
as i’ve said before, when i post a trade idea, i will usually give well-defined profit targets and sometimes, but not always, give suggested or objective stop levels. every trader and investor has a different trading style, risk tolerance and even different targets on the same trade posted here. e.g.- a very active, short-term trade might target T1 and use a very tight stop while a long-term swing trader might target T4 with a much wider stop. therefore, as stop levels vary widely but my targets are clearly defined, i tend to most often follow-up on the trades that hit these profit targets and not so much on those that don’t pan out or even those that may have hit one or more targets and then reversed.
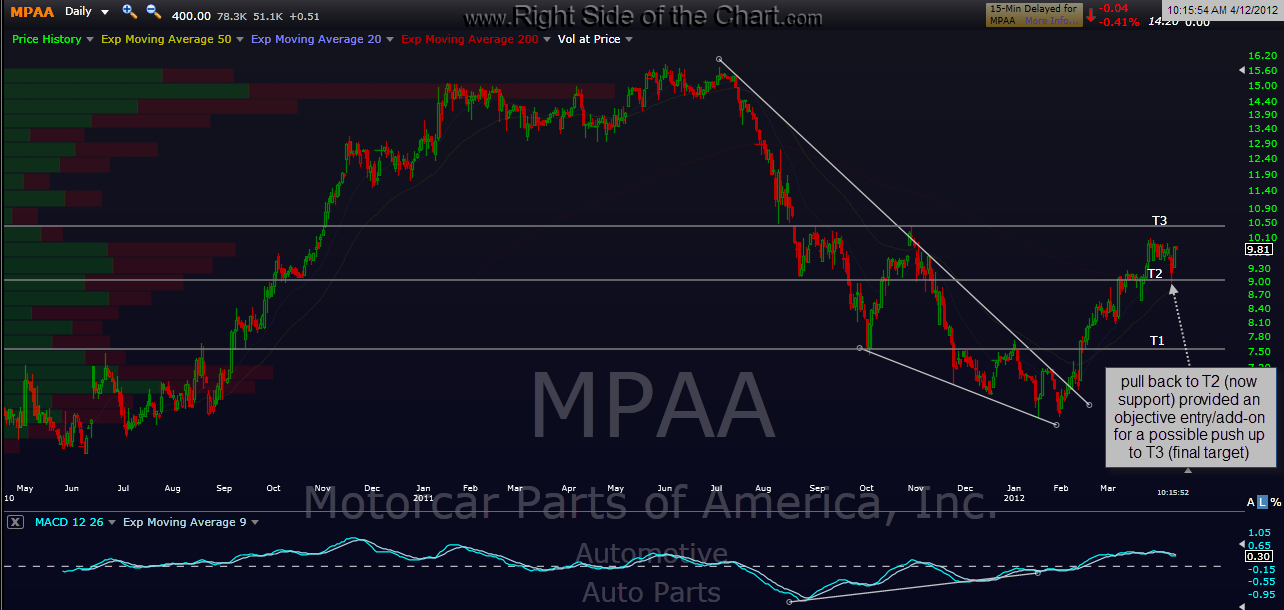
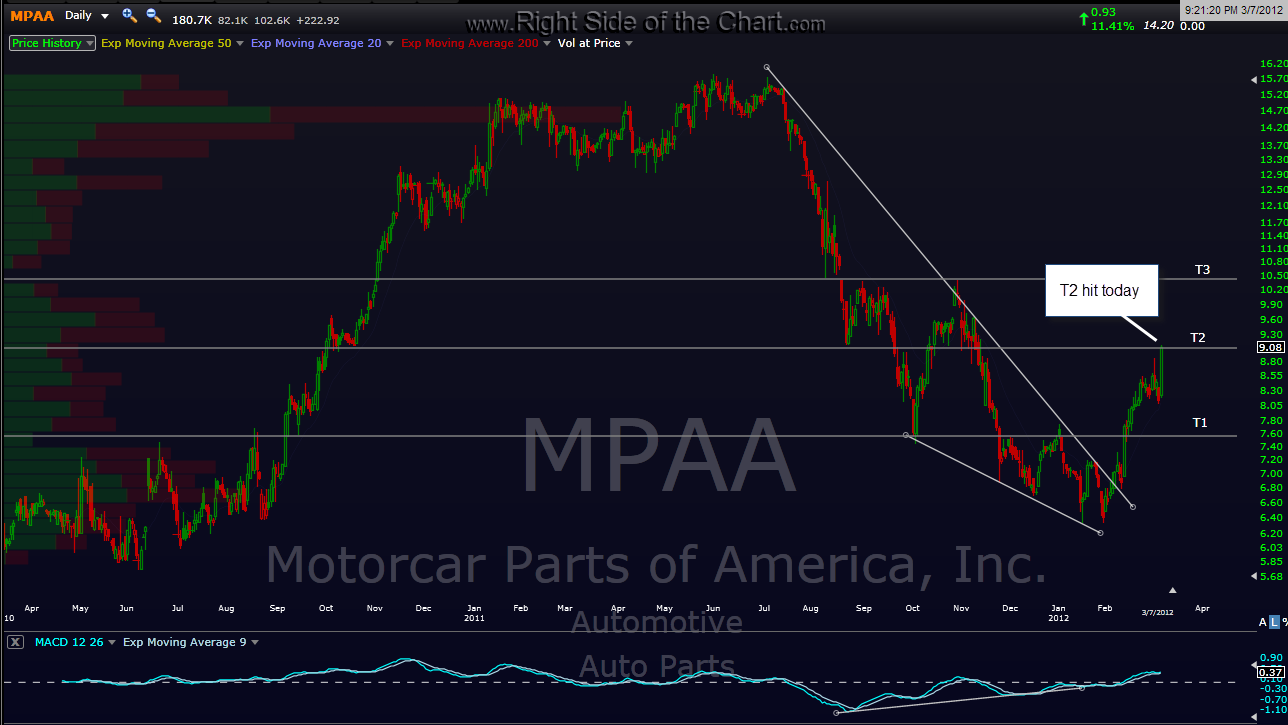
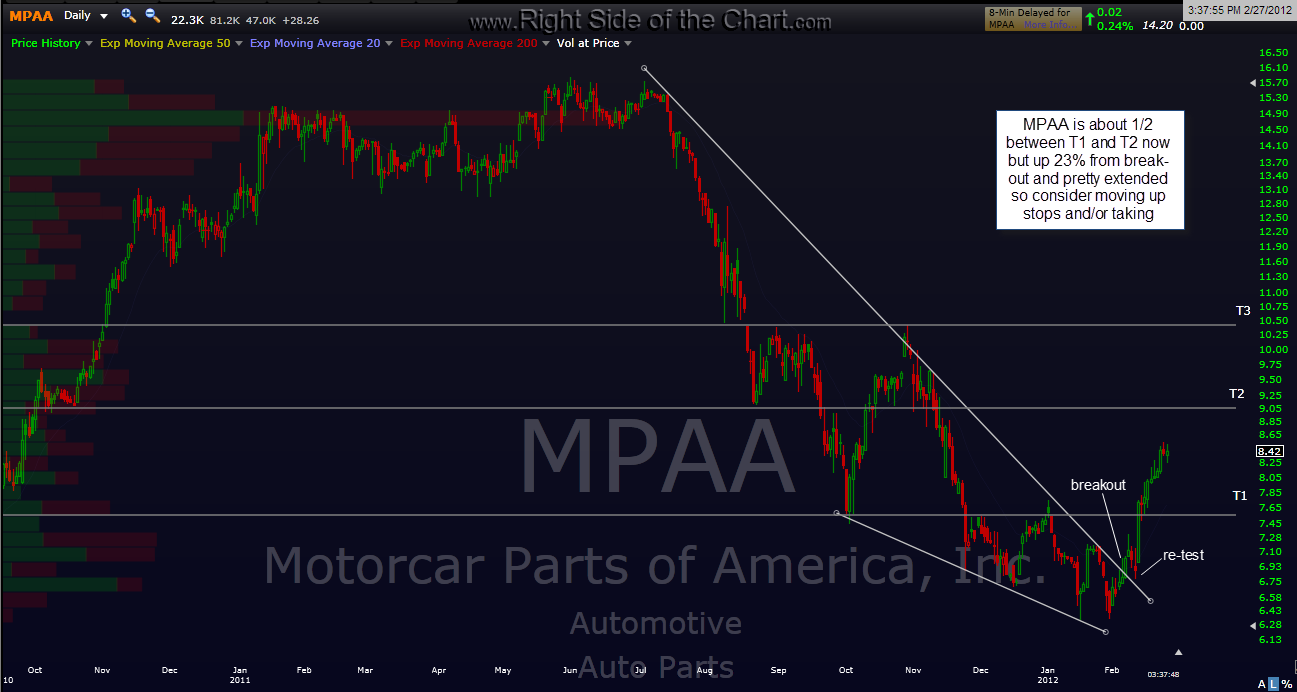
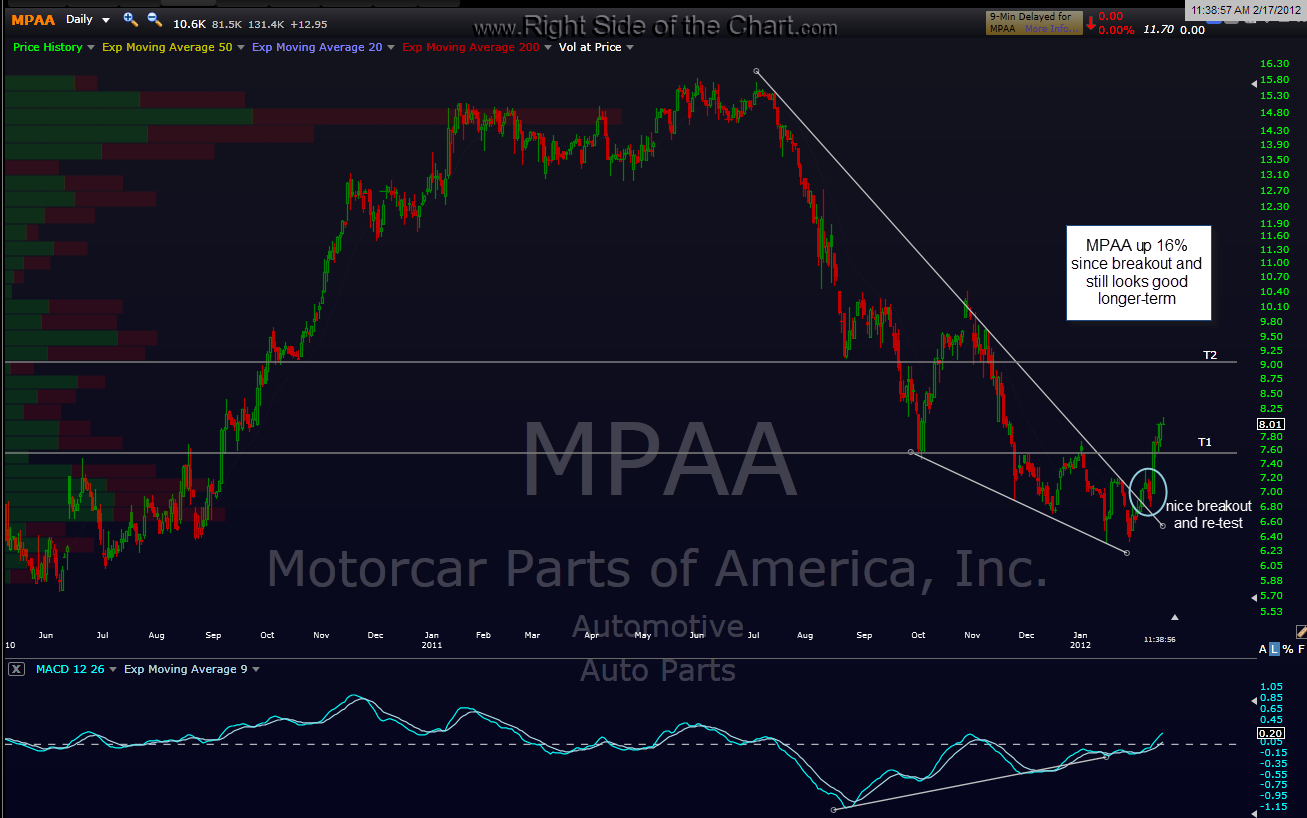
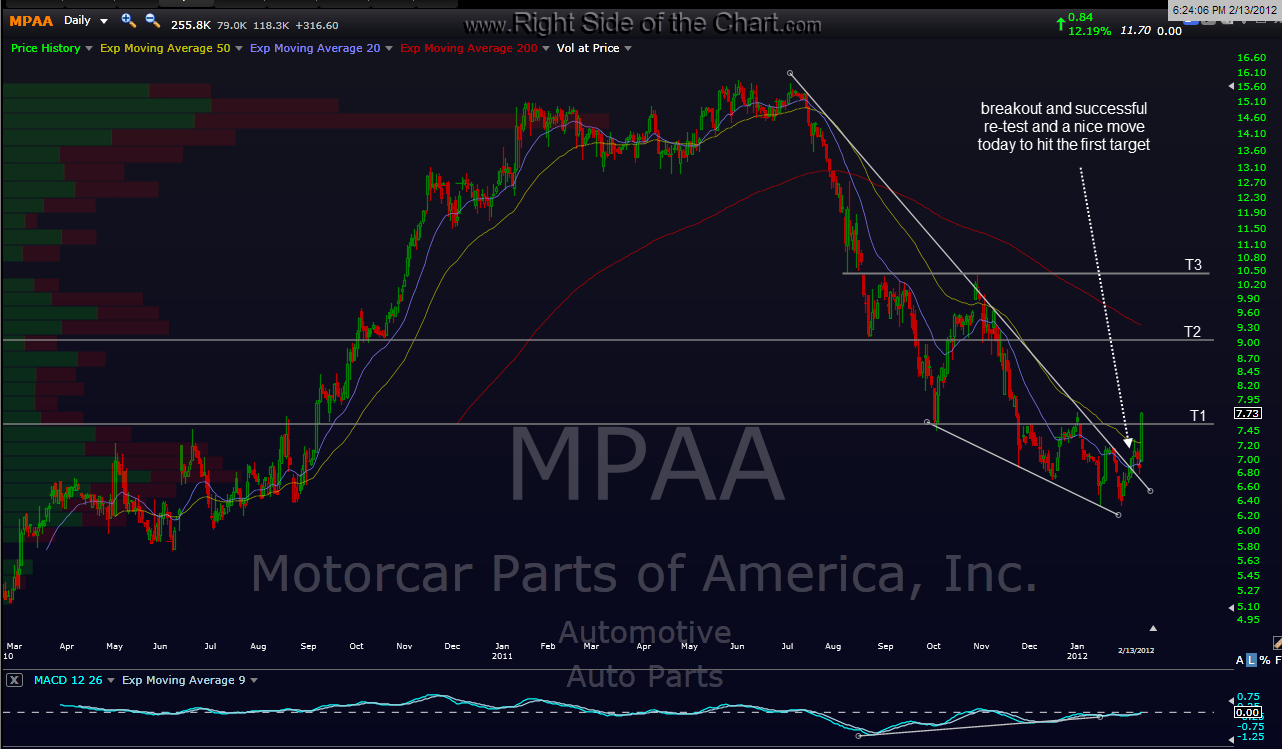
here’s a good example; as i’m culling thru the active trades today, i noticed that i haven’t updated MPAA in a while. MPAA broke out in early february and hit T1 for a nice gain about a week later and then hit T2 for a 31% gain one month after breaking out (where i posted both targets being hit as potential profit taking areas and/or raise stops). after consolidating around T2 for a little while, the stock then moved higher, peaking out at about a 46% gain from entry less than 2 months after triggering a buy signal (breakout).
when i update the performance tracking form for the month of april, i will not claim a 46% gain on MPAA. my policy is to use the highest target that was hit before a reasonable stop would have been triggered (in this case, T2 at a 31% gain). of course, many traders would have been trailing stops higher on the trade and may have been stopped out somewhere above that T2 level and below the highs shortly after the stock reversed. likewise, they might have been stopped out much earlier along the way on one of the pullbacks. my point is that there is an unlimited myriad of possibilities on where one could have taken profits or stopped out.
i will admit that even by using this method, the performance results on my trade ideas is probably still widely over-stated compared to what most traders, myself included, would have realized on these trades. however, i believe this is about as accurate and honest as i can be in representing how the trade ideas posted here have performed. also keep in mind that with the sheer number of trade ideas posted here, it is onerous enough to keep track of those trades that were successful (as defined by hitting at least the first target) but to keep track of every trade idea that has triggered and did not pan out (which is typically the case with almost any seasoned trader or investor using the “cut your losses and let your winner run” mantra) would be nearly impossible.
with that being said, here’s the updated chart of MPAA along with the string of previously posted charts for reference. this is a great visual reference for not only how well technical analysis can work by identifying a bullish pattern setting up in a stock that is in a strong downtrend and identifying likely target areas, before the stock has even changed trend and broke out. just as a side note, MPAA might be good for a bounce trade here as it has pulled back very sharply to T1 (former resistance, now support) and is very oversold in the near-term. personally, i’m going to pass as the intraday charts aren’t confirming a likely bounce but figured i’d point it out to anyone who might see something there that i don’t. this time around i’m posting these charts in chronological order as posted (oldest first) for an easy visual reference of the trade.