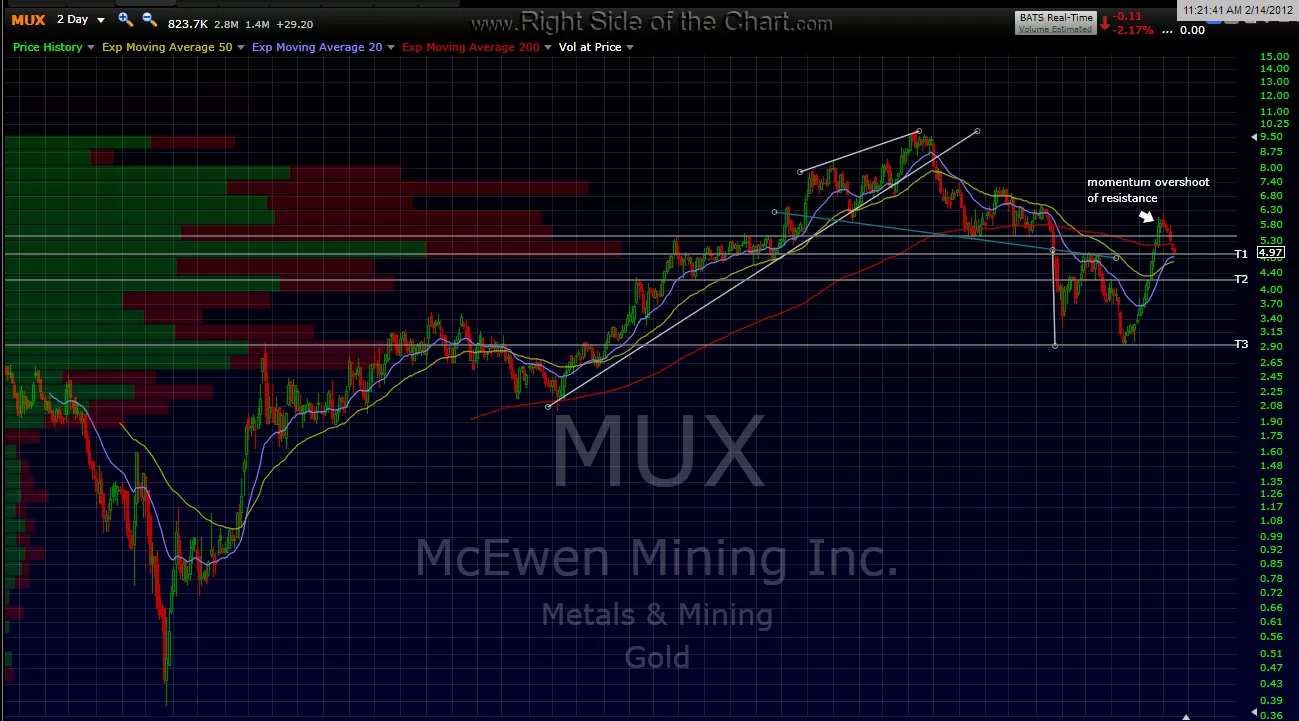
for anyone in the MUX short, it has now (finally) hit T1. personally, i am holding out for at least T2 on this trade. i’ve made several posts along the way which can be found doing a search on both “MUX” and “UXG” (previous ticker symbol). this one was a short at resistance but as i mentioned, i was giving it a lot of room since it was on a near-parabolic momentum-fueled rip and therefore, an overshoot of resistance was not surprising.
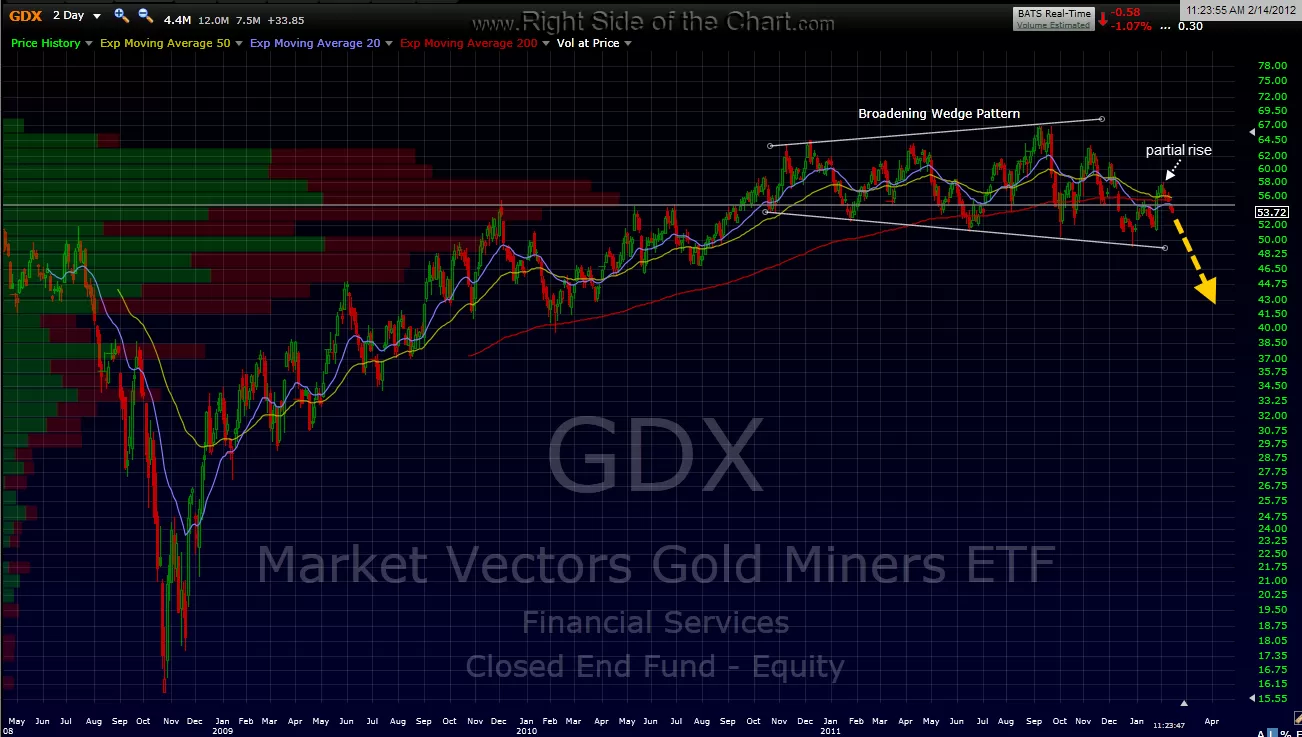
with that trade, i wanted to share this GDX 2-day chart. i mentioned shorting NUGT (3x long miners etf) back on feb 6th as gold and gold stocks are currently among my favorite swing shorts. i had also mentioned a couple of weeks ago that i was eyeing a potentially bearish pattern formation in GDX but i wanted to wait for at least some early signs of confirmation. the pattern that i was referring to is called a “partial rise” and it occurs within broadening top patterns. basically, when you have a mature broadening top pattern, as we do in GDX (best viewed on the weekly chart or the 2-day chart posted below) and you then get a tag of the lower trendline line and then a partial rise, often around a 50-61.8% retracement of the prior move down, and then that rise stops and turns back down, this is a bearish signal that results in a downward breakout of the pattern 61% of the time (according to bulkowski). prices often pause at the lower trend line but sometimes they just keep accelerating downward right thru it. either way, the GDX/NUGT short aligns well with the pattern on my GLD short as well and this is just another check-mark in that column, for now. appropriate stops might be just above the level where prices recently turned down on the recent partial rise. targets TBD.