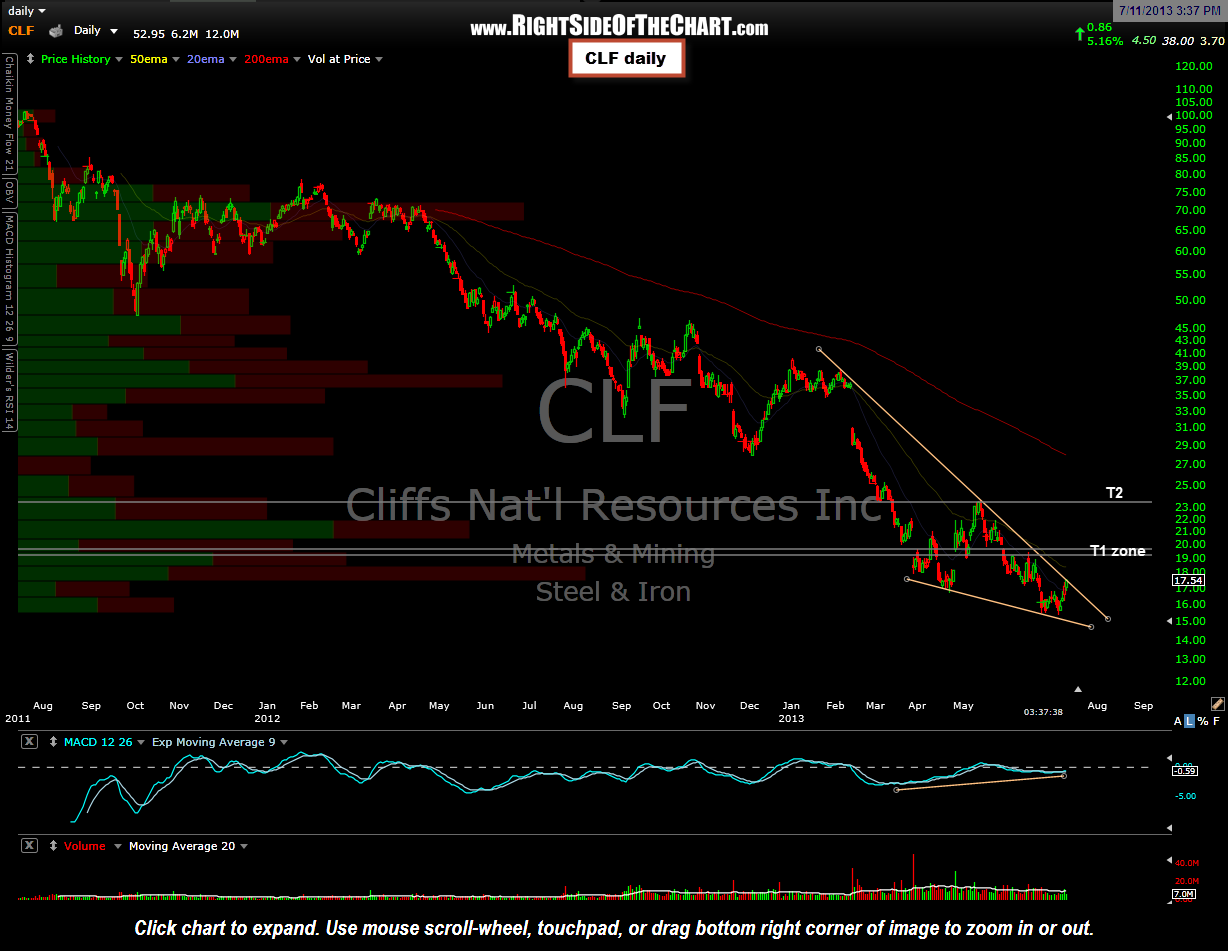
 The CLF active long trade is now at the top of the large falling wedge pattern on the daily chart. I still like this pattern for a long-term trade and have added some initial swing target levels. These targets may be tweaked if/when the stock breaks out of the wedge pattern and I will follow up with the exact suggested target levels soon. Keep in mind that the downtrend line that defines the top of the falling wedge pattern is resistance until/unless broken. Therefore, the stock could make another pullback from current levels and continue to consolidate within the wedge or the stock could break out & run anytime now (especially considering where prices are in relation to the apex of the wedge). CLF will remain as both an Active Trade and a Trade Setup for now as any break above the wedge, ideally on above average volume, would trigger a new objective long entry. Updated daily chart.
