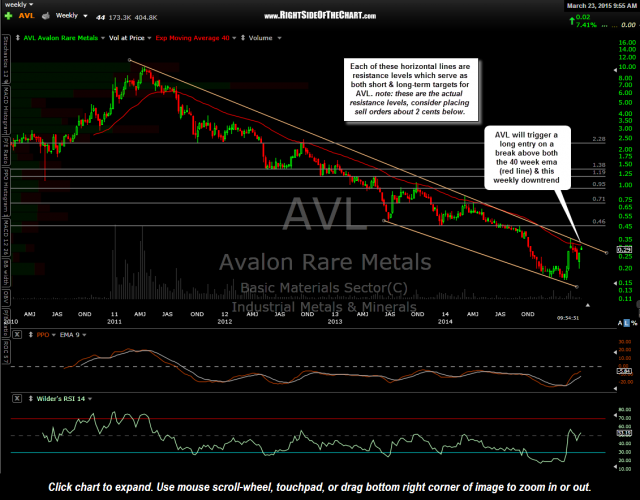
AVL (Avalon Rare Earth Metals) will trigger a long entry on a break above both the 40 week ema (red line) & this weekly downtrend line. AVL was one of several Rare Earth stocks discussed in the Feb 19th Rare Earth Stocks Video which, at the time, was approaching the key 40 week exponential moving average (which is equivalent to the 200-day moving average). AVL, as with most of the other Rare Earth stocks which have been capped by the 40-week moving average during the vicious bear market the sector has been in over the last several years, once again found resistance by failing to close above the 40 week ema shortly following that video.
I had mentioned in that video that most of the Rare Earth stocks were very extended from the recent rally at the time and could probably use a pullback to help work off the near-term overbought conditions. The sector did make a healthy correction along with the gold mining stocks (which the Rare Earths have a fairly tight correlation). As such, with the near-term overbought conditions now alleviated, many Rare Earth stocks have a much better chance of making a sustained breakout above their 40-week emas and/or other key resistance levels such as major downtrend lines and/or horizontal resistance levels.
My plan is to resume scaling into a basket of individual rare earth stocks, most of which I started scaling into earlier this year but held off when the the near-term technical outlook for both the Rare Earths & the Gold/Silver mining stocks turned bearish a couple of weeks ago. Now with the outlook for the mining stocks turning increasing bullish over the last week or so, I will resume scaling into the basket of Rare Earth stocks along with select mining stocks.
AVL will also trigger an official long entry as both an Active Long Trade (i.e.-typical swing trade) as well as a Long-Term Trade Idea with the official criteria being a weekly close above both this long-term downtrend line AND the 40-week ema. More active swing traders might opt for an slightly more aggressive entry of any move over the .34 level, which would take AVL above both the 200-day ema/40-week ema as well as the downtrend line. Both near-term & longer-term potential targets are listed on this daily chart (actual resistance levels, consider setting sell limit orders a couple of cents below your preferred target level). Official price targets & suggested stops will follow.
The potential advantage to taking the breakdown intraday and/or intraweek vs. waiting for a weekly close is that AVL could begin to rally sharply by the close of trading at the end of the week, should a lot of buyers come in immediately following the breakout. The potential pitfalls of taking a breakout based on weekly resistance levels before the close on Friday is that it is not uncommon to see prices trade above resistance during the week, only to close back below resistance by Friday’s close. Graphically, those instances are identified by a weekly candlestick with a wick (shadow) above the resistance level but a body below it, as the body of a candlestick is made up of the opening & closing prices with the shadows representing the intraweek highs & lows.


